Map and reality: diagrams
In the previous two parts, we’ve figured out that the preferred distortion and layers depend on the map’s supposed use case.
With public transport maps, our goal is to help the customer get from point A to point B using the displayed transport network.
This is a map of Paris Metro of 1915:
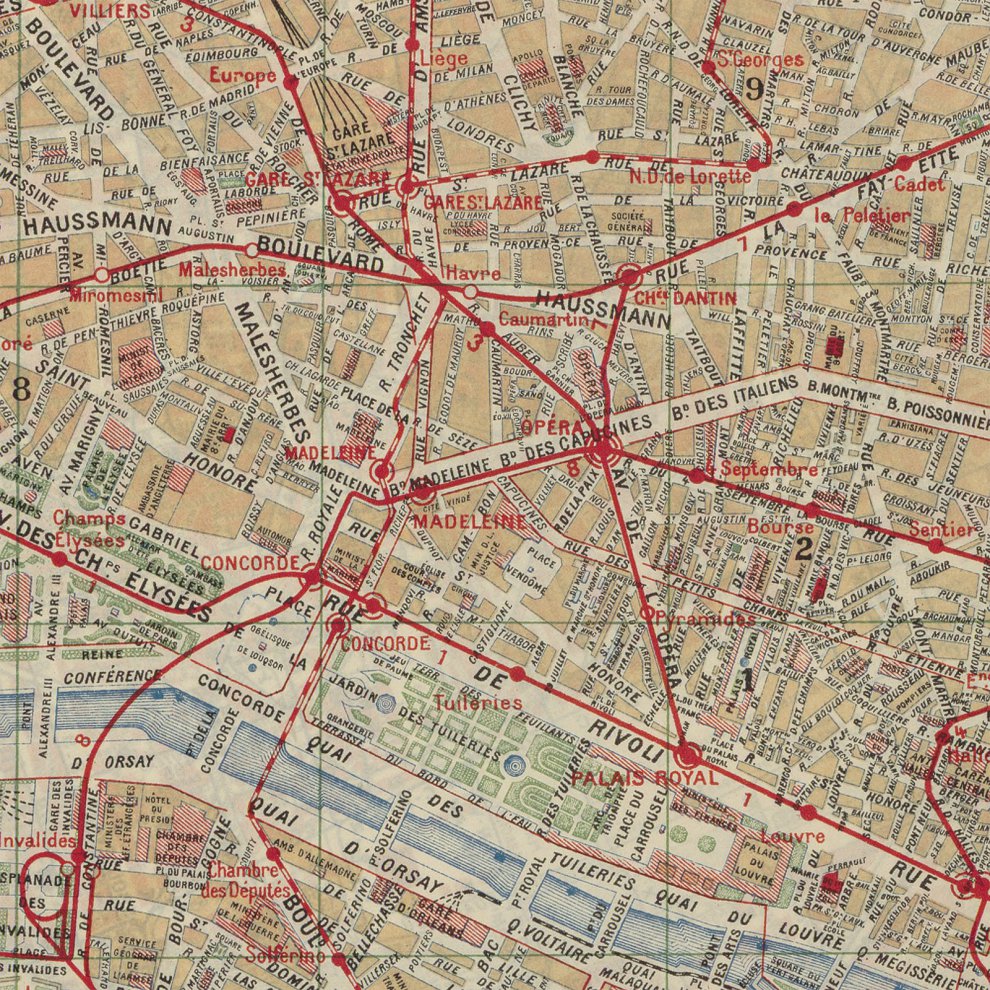
The city is shown in full detail. There are many layers. The metro lines, however, stand out because of the use of contrasting red thick lines.
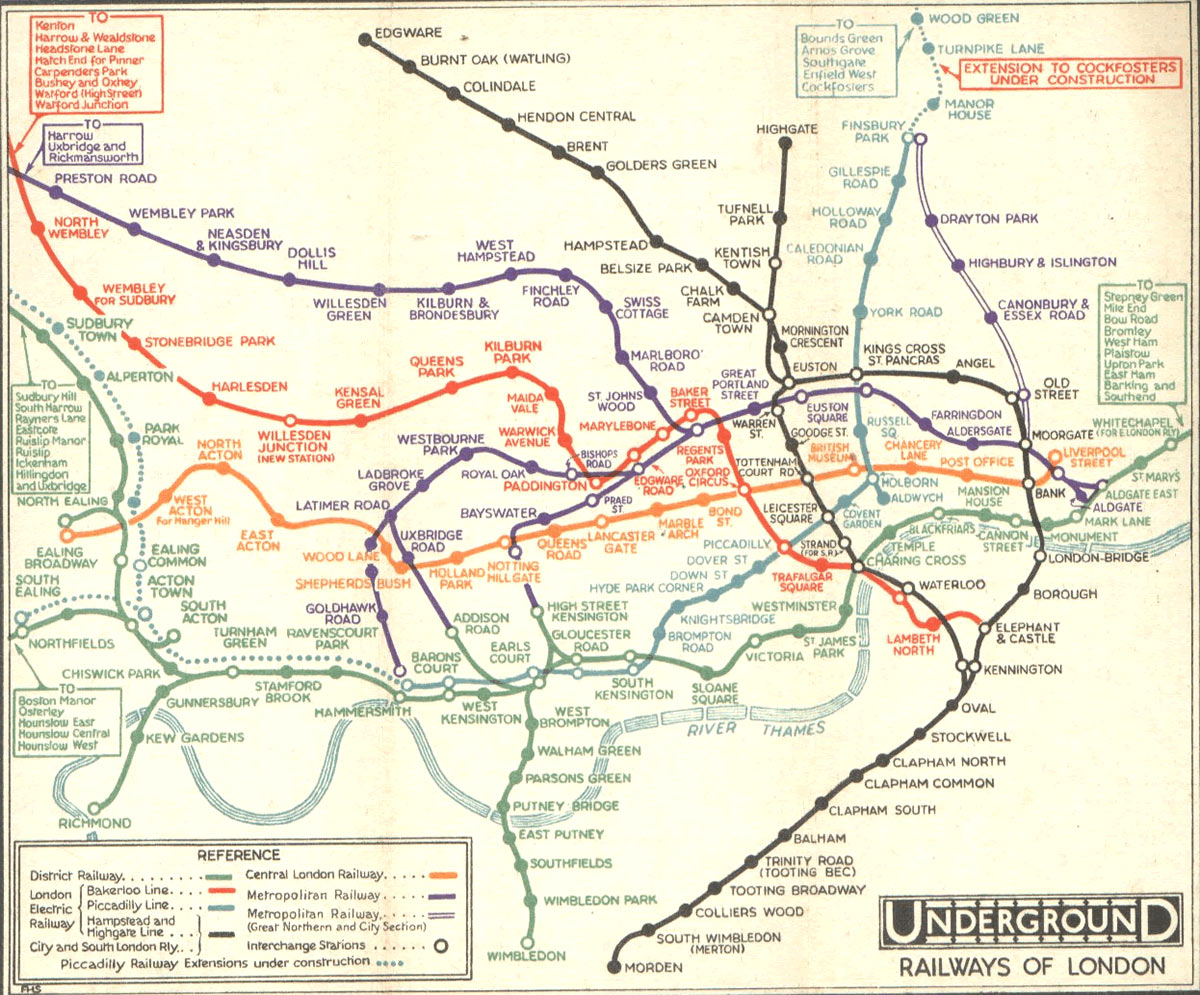
Compare with the map of London underground railways of 1908:
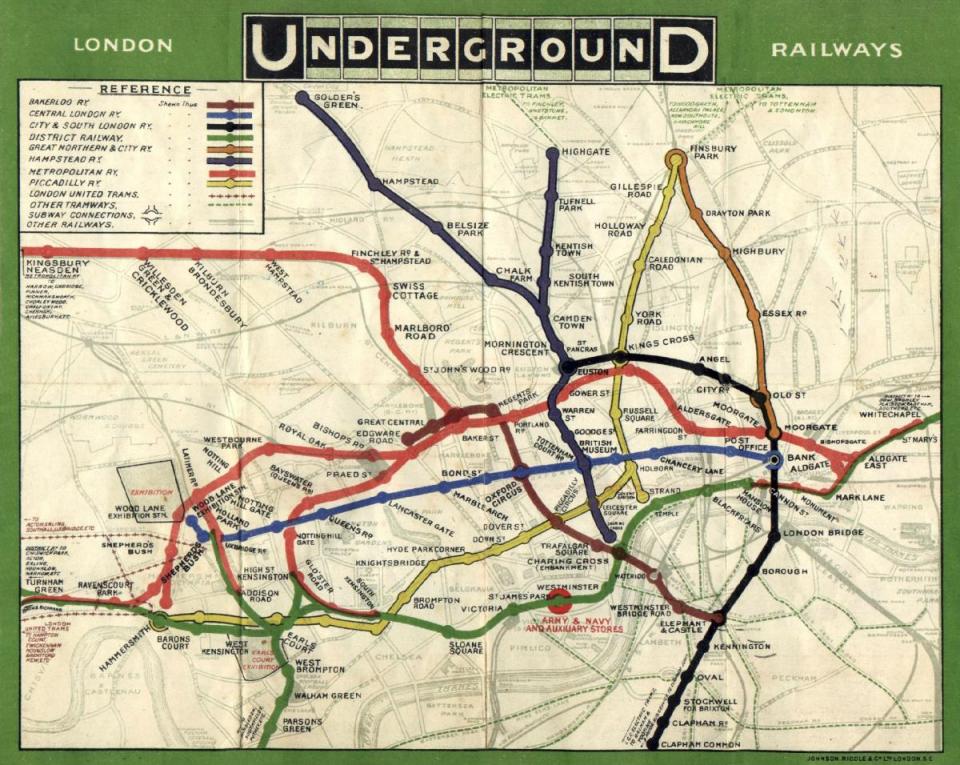
The lines of different railways are denoted by different colours. The rest of the city — the roads, the parks and the river — makes one pale-gray layer.
But even this layer is removed by 1932:
The river Thames is the only non-railway object that remains on this map. And it is the only device that links the railways to the surface geography.
It is always interesting to explore a detailed map with lots of layers. But in this case, the pleasure of exploration is much less important than the customers’ ability to quickly pick out which train to take. The information richness is sacrificed to the comprehension speed.
But as we see, despite all the simplifications, the central part is still rather hard to read. In several places, arrows had to be used to clarify the correspondence of labels and stations.
The engineer Harry Beck has come up with a radical idea. He suggested redesigning the maps using the principles of electrical circuit drawings.

Such drawings prioritise the logical connection between the elements over their physical position. What if a railway map also displayed first and foremost the logical connection between the stations?
The Beck’s diagram replaced the map in 1933:
All lines segments were put to the angles of 45° and 90°. The distances between stations were equalised.
The modern diagram has twice as many lines and many more layers, but it inherits the Beck’s principles:
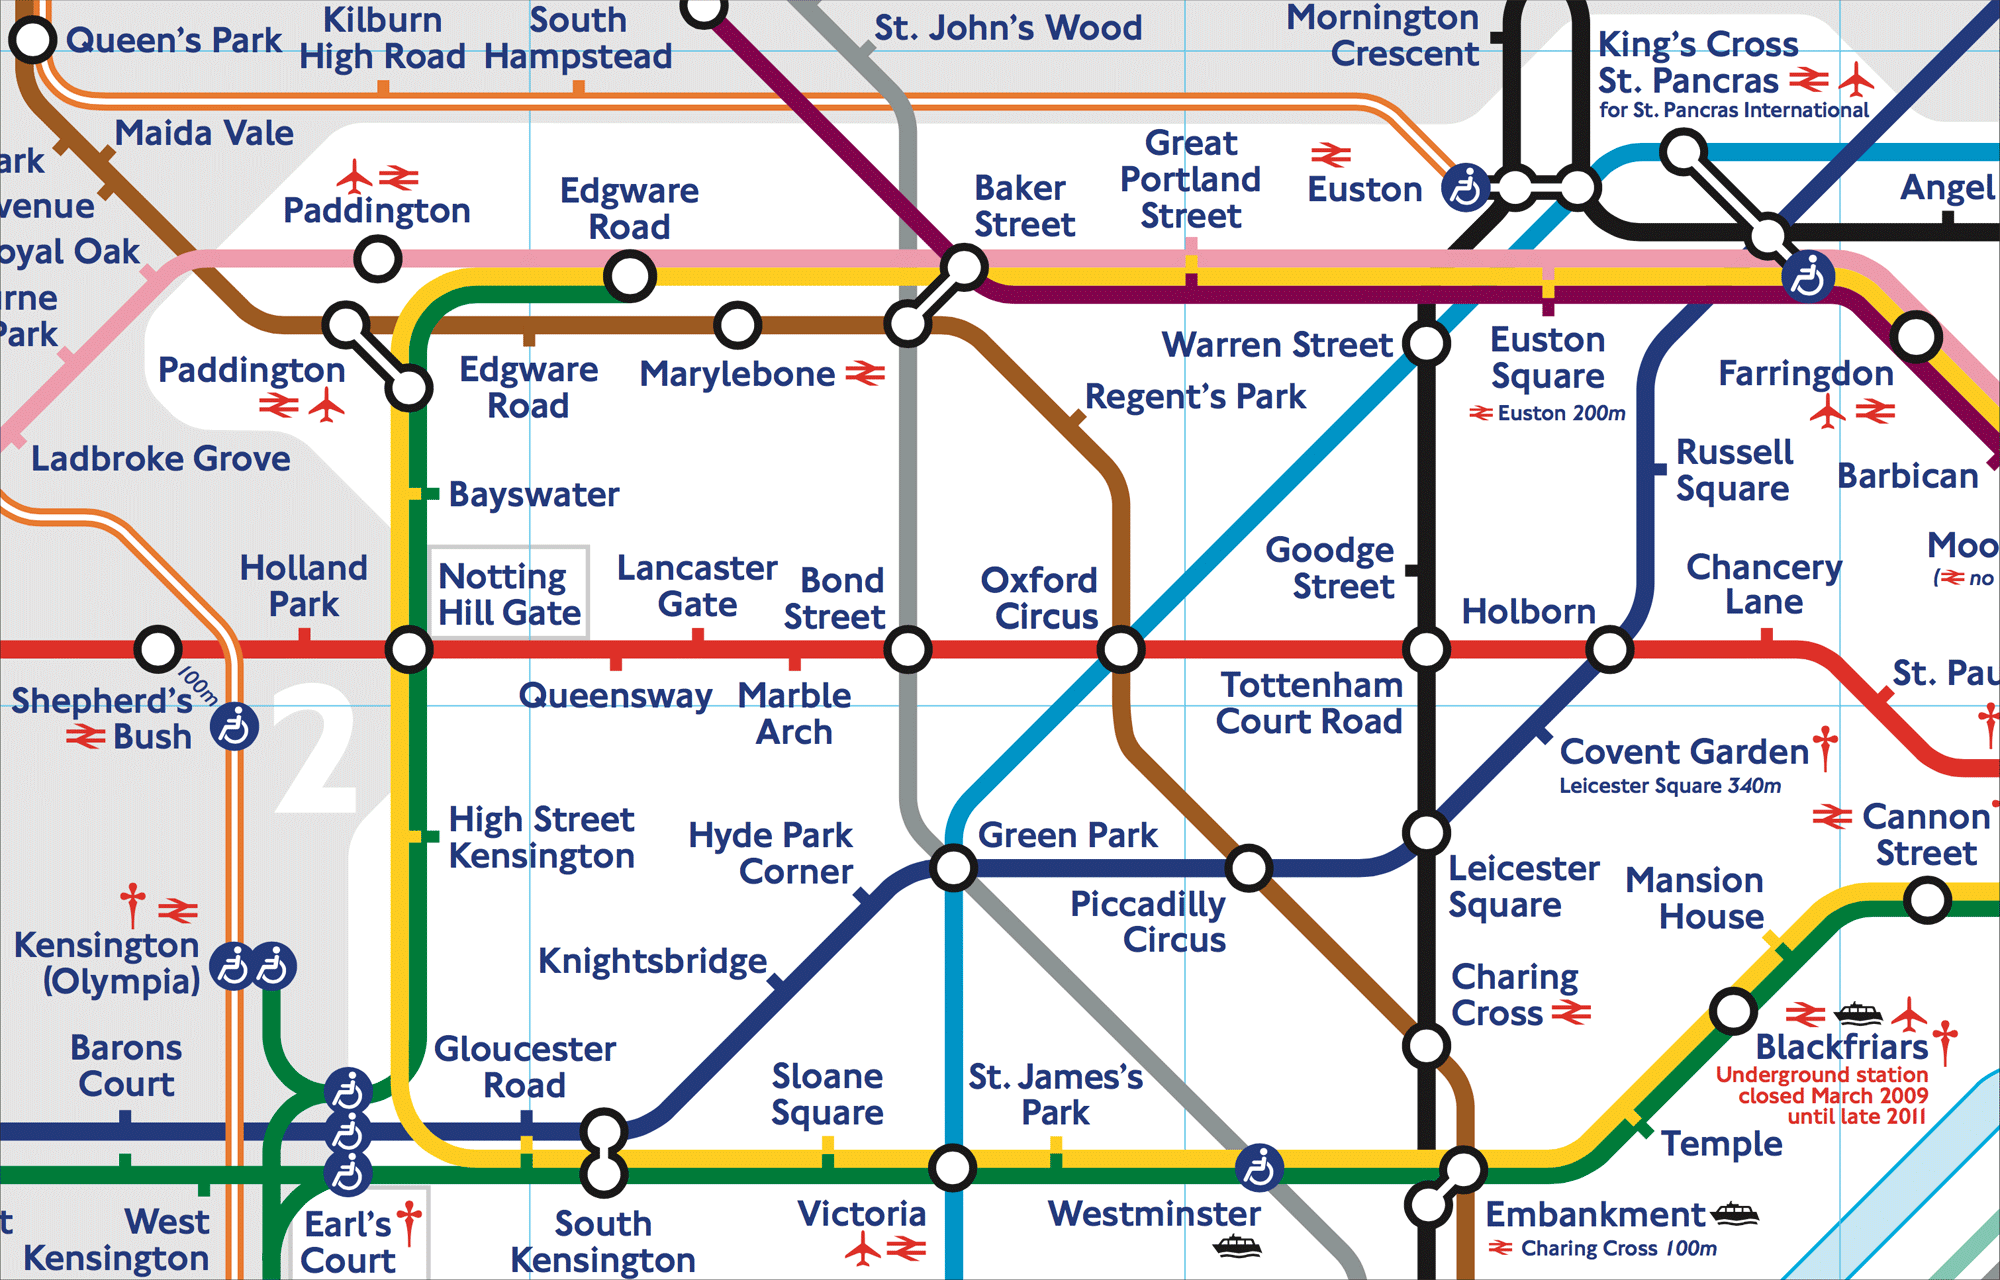
Compare with a geographical map of the same lines:
The central part here is so dense that it had to be put in a cutaway at a bigger scale. And even so, everything turned out very small. Now we see that showing “true” geography is not universally useful. This geographical map is much harder to read. For the railways’ customers, the diagram excels.
If the distances between the stations are equal, the reader will grasp that it’s just a convention and won’t rely on it. If the lines are strictly at 45° or 90°, the reader will grasp that they do not represent the actual paths of the underground tracks and won’t rely on it either. But this doesn’t mean that you can get rid of any geographical reference.
In 2007 I made a rectilinear Moscow Metro map as an experiment:
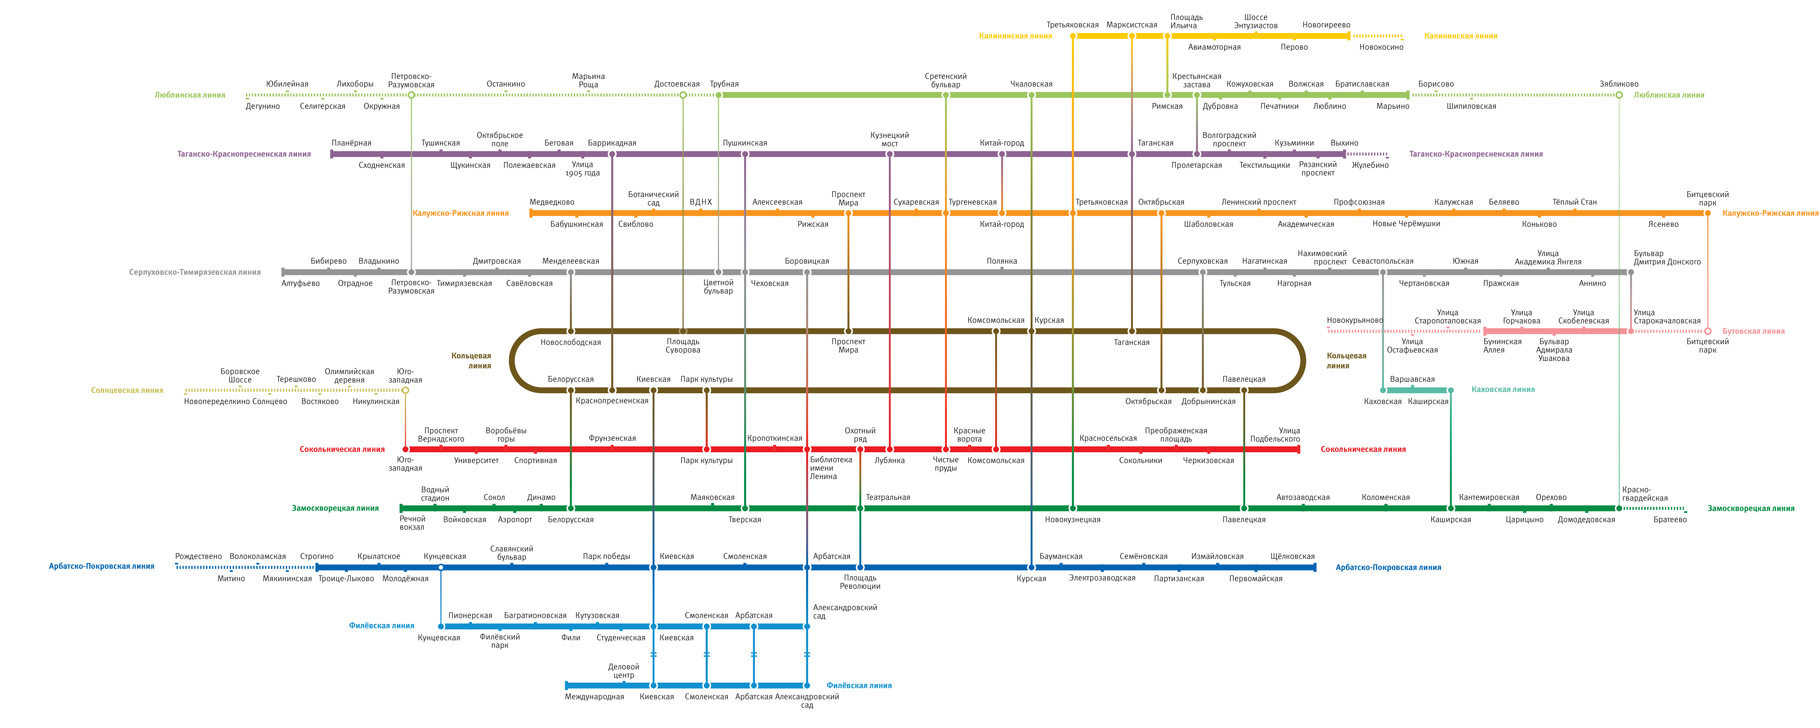
While the principles of the above diagram are easy to figure out, there still is a problem: even if you live in Moscow, you will have a hard time finding your station.
Since any map is perceived in reference to the image of reality formed by the geographical maps, you have to respect that. If the reader knows roughly where a station is in the city, they should be able to find it on the diagram, too.