Superpedestrian fleet management interface
Superpedestrian is an e-scooter manufacturer and a sharing service operator. I made them a fleet management interface. Here, the manager responsible for a city or region evaluates and improves the efficiency of scooter utilization:
If there are fully-charged scooters in the warehouse, it’s a good idea to get them out to the city. But we pay the van driver to distribute scooters, so if we expect to have a dozen more charged scooters in an hour, it is better to distribute them all at once a little later. Spare parts are cheaper to order in packs, so it is useful to understand the statistics of what breaks more often. In some cities the law does not allow riders to leave scooter in random places, in some cities it is not allowed to leave them idle for more than some time. The manager needs to find such problems and solve them promptly.
Before, it was just a database with filters: to see scooters with a certain battery level or that hadn’t been used for a certain amount of time, you had to construct a query. In conversations with managers around the world, I identified numerous specific situations that previously had to be manually searched for by setting different combinations of filters. An example: a scooter has been repaired and taken to the city, but users can’t see it on the map and can’t rent it because somebody forgot to remove its “in repair” status.
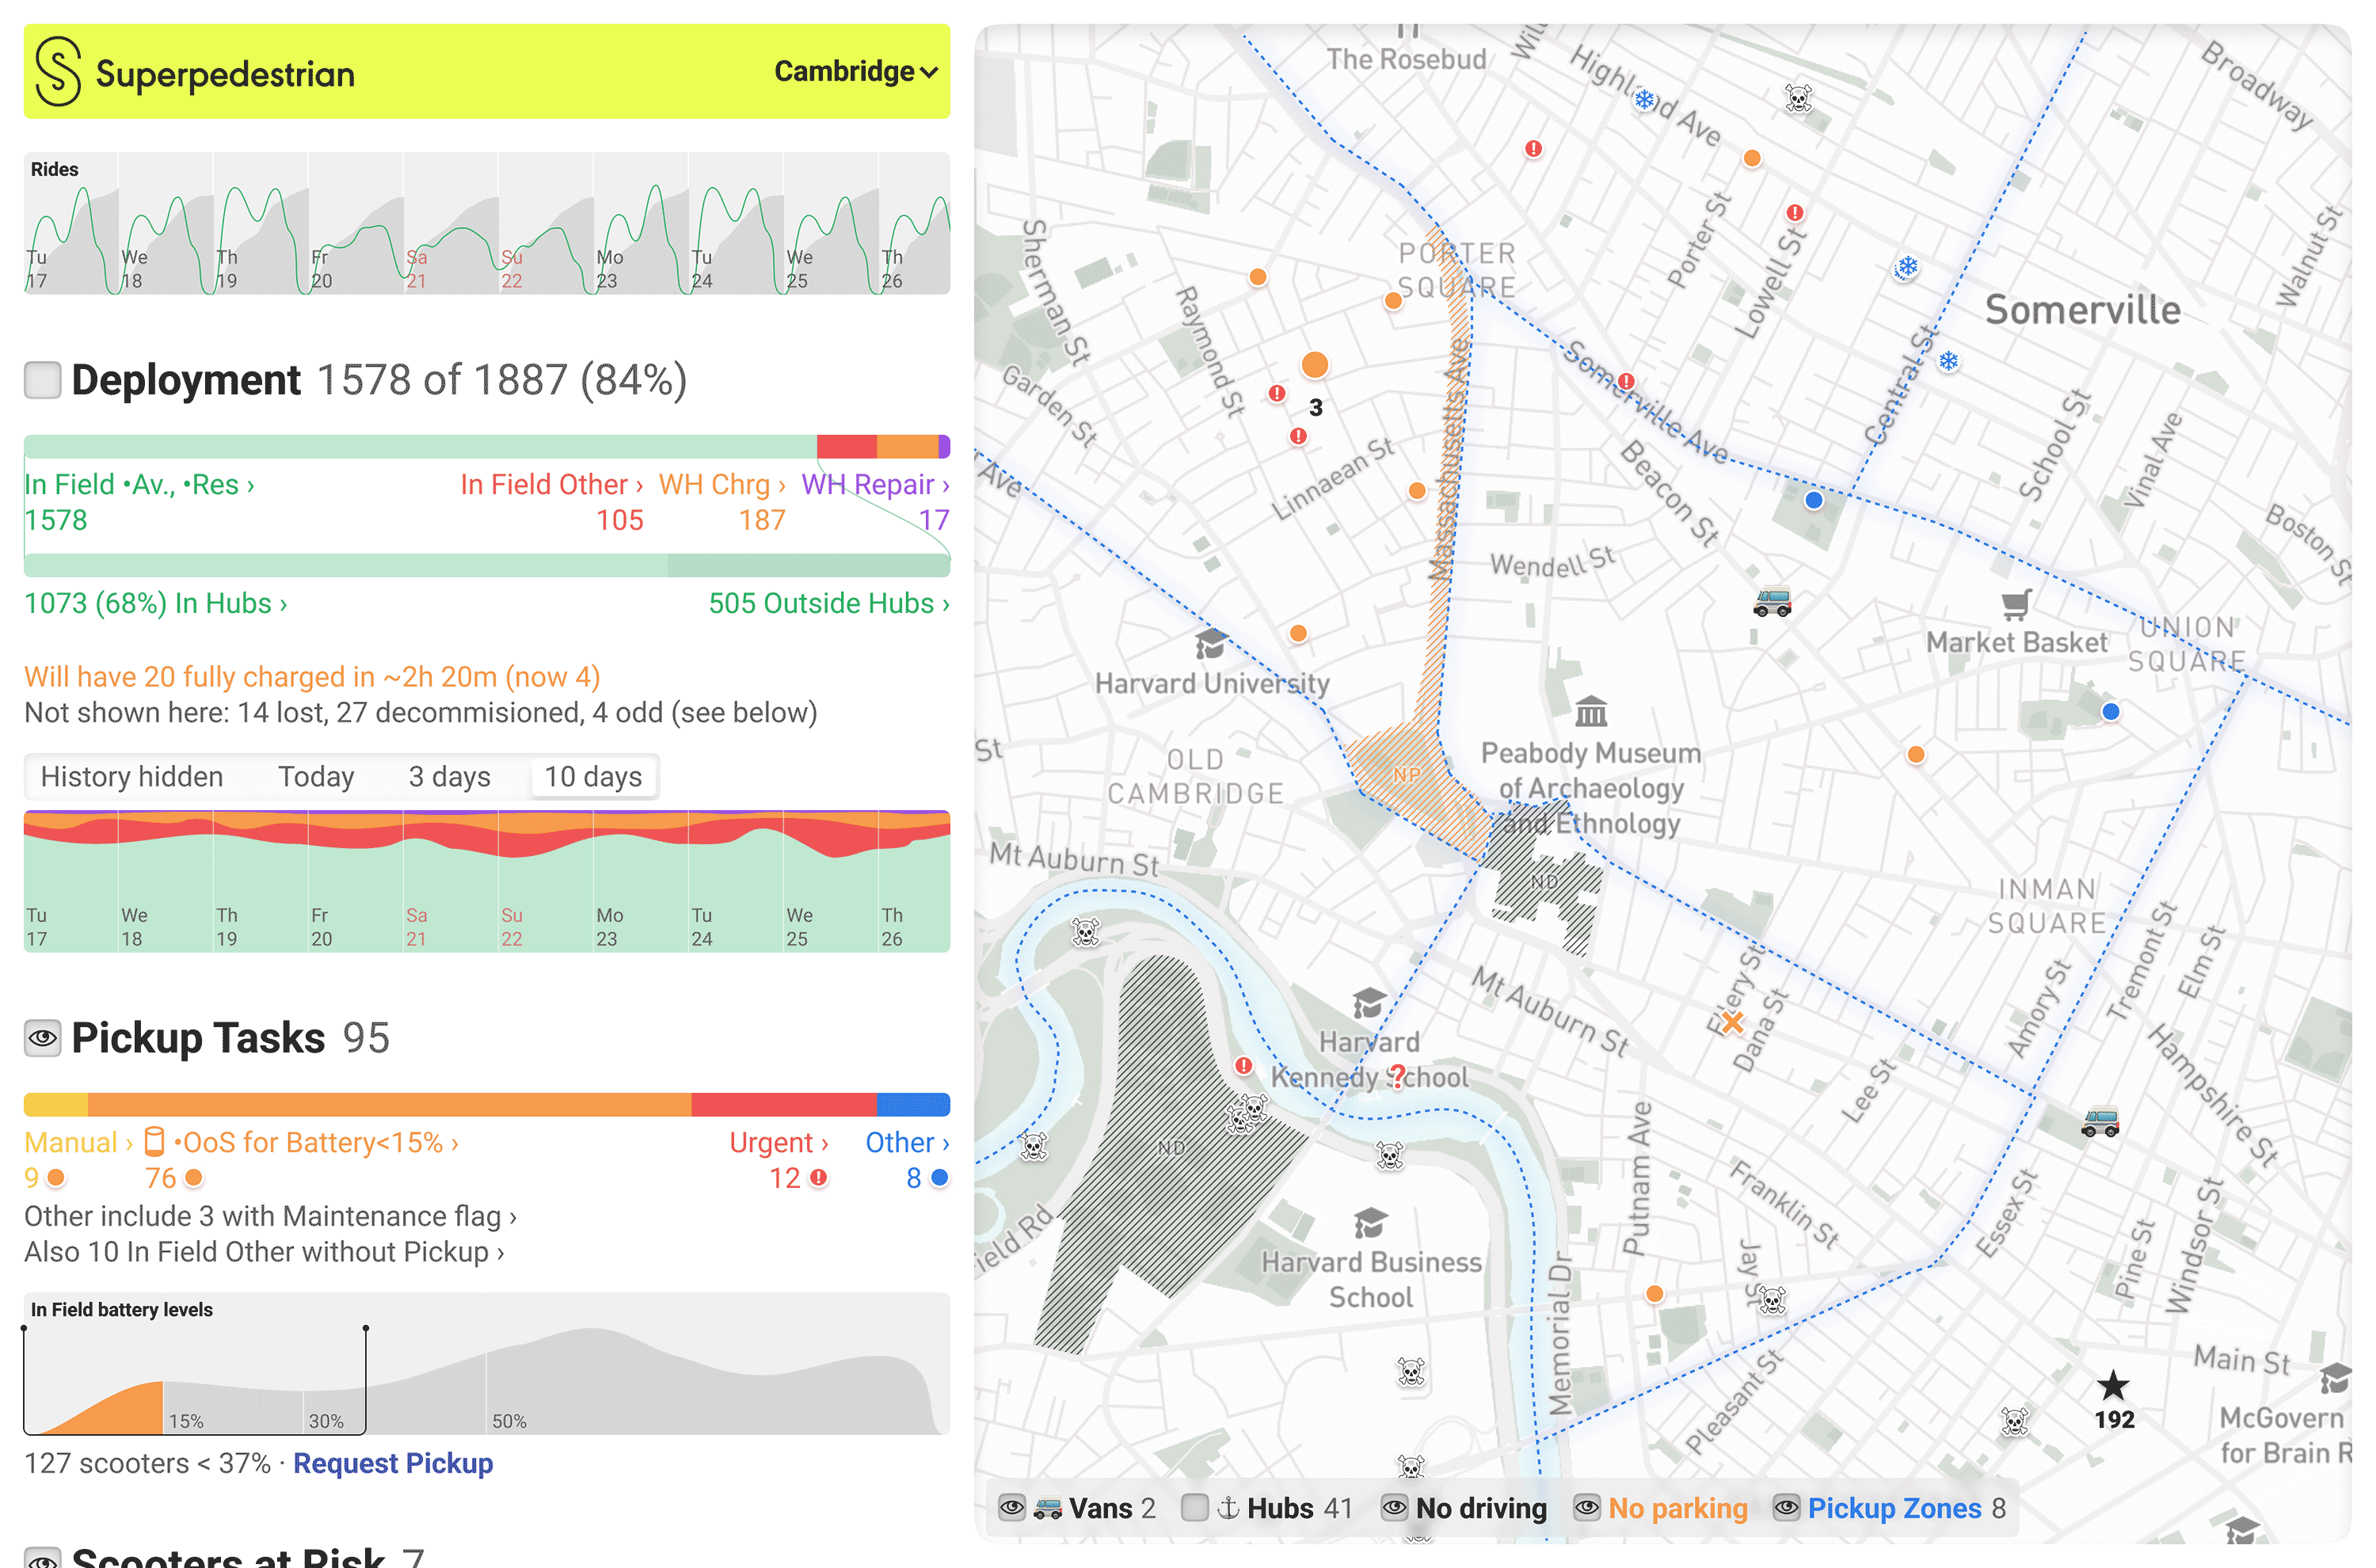
Now there is a main overview screen that contains all the information a manager cares about and all the tools to make decisions.
Data widgets scroll vertically on the left. They are also the legend and control tool for the map on the right. For example, if a widget shows 7 problematic scooters, you can turn on the “eye” and those 7 scooters will appear on the map.
Organized by tasks
At the highest level, the manager’s tasks are to make more money and not lose scooters. Widgets show exactly the data that helps with these tasks.
The first section shows the breakdown of scooters by status and placement. Here you can see what proportion of the fleet is “in field” and where, exactly:
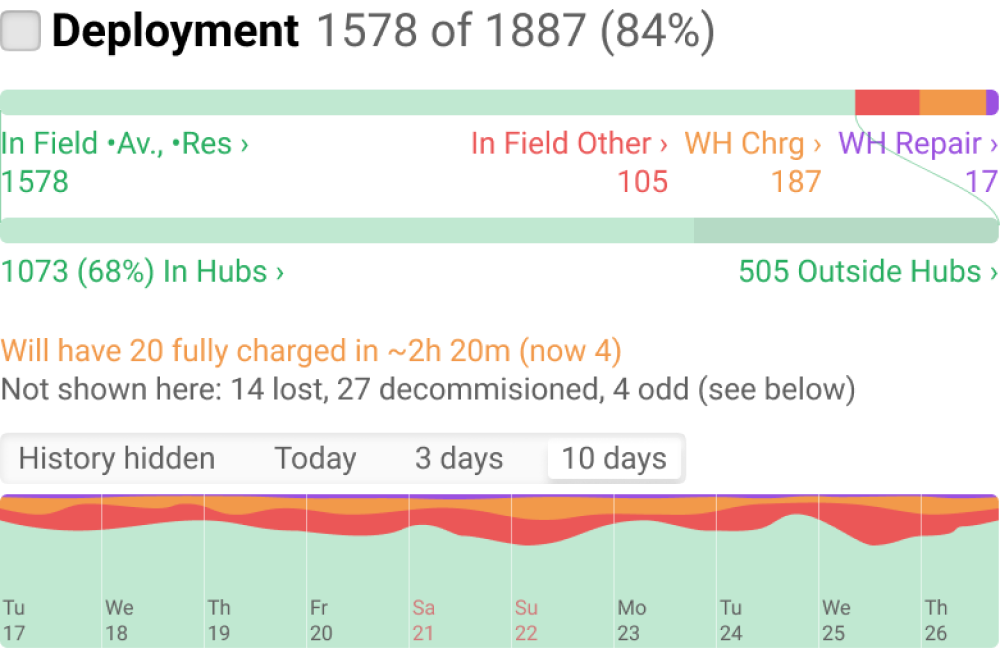
To enable the manager to plan the van drivers’ trips, the system predicts how long it will take before there are enough charged scooters in the warehouse to make it worthwhile to distribute them. At the end of the section is the status breakdown history for today, three, or ten days. This helps you see context and spot anomalies more quickly.
Next come the scooter pickup tasks:
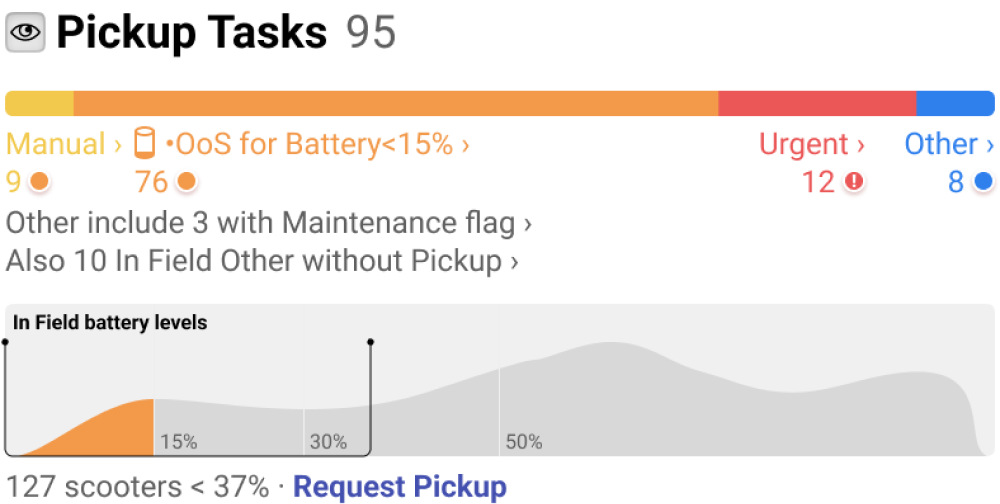
Pickup tasks go to van drivers. Most tasks are created automatically because of a dying battery or some failure.
You can also create pickup tasks manually. The graph shows how the battery levels are distributed among the scooters in field. You can select a range of, for example, all scooters that have less than 37% — you can see that there are 127 of them — and request to pick up all of them. This is useful if you have an event coming up in the city, when high demand is expected and you want to charge more scooters in advance.
The next important section is risks. This is what helps to deal with the task of not losing scooters:
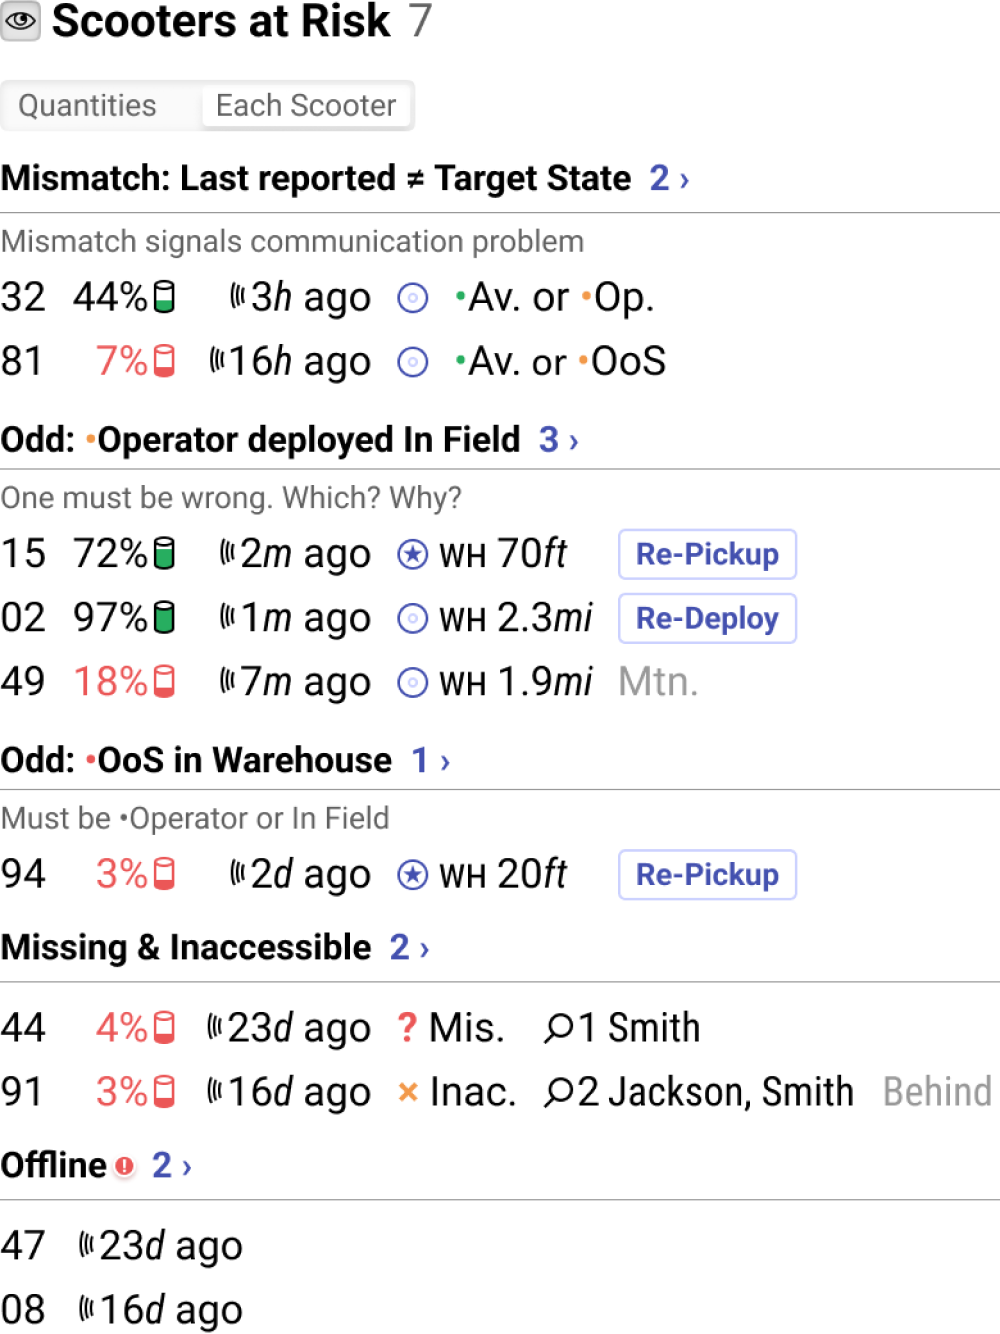
Here you can see scooters with strange statuses, connectivity problems, software problems, and more. Right in the table, key data related to the type of problem is shown and buttons with the most probable commands are given.
For example, scooter 94 is listed as out of service, which means it will be in a pickup task, but according to geolocation it is in the warehouse. We’ll have to check if it’s actually in the warehouse, or maybe it’s having a problem with its geolocation. Meanwhile, scooter 91 is unavailable (according to geolocation it is inaccessible on some private property), and a search has already been attempted twice, but so far with no luck. We have to decide whether to give it another try, or to involve the police, or to say goodbye to this scooter forever.
The final section is check-up:
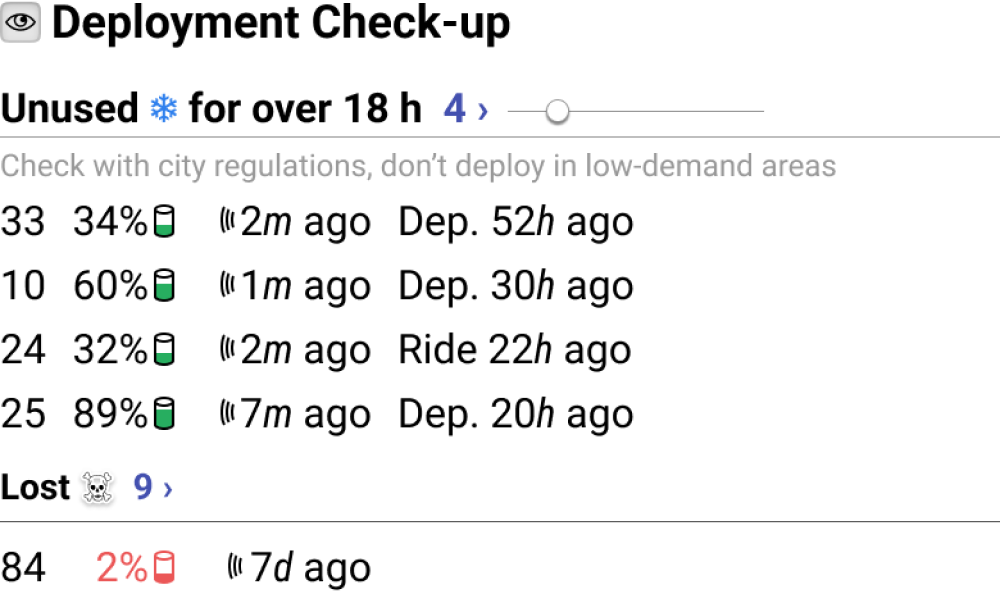
The manager only reaches here if everything above is fine. There are the scooters that are probably not optimally placed in the city. For example, here are four scooters that have not been used for more than 18 hours. The manager may notice that some neighborhoods don’t use scooters much, and try to place them differently.
Lost scooters are also interesting. You can use the map to notice scooters going missing in certain neighborhoods: maybe they are more criminal and you need to talk to the police or maybe there’s poor cell service and you need to limit travel there.
Each section has an arrow › that opens the corresponding database selection the old way. It’s useful when the information in the overview is insufficient or you need to export raw data for technicians.
Any logical group can be shown on the map:
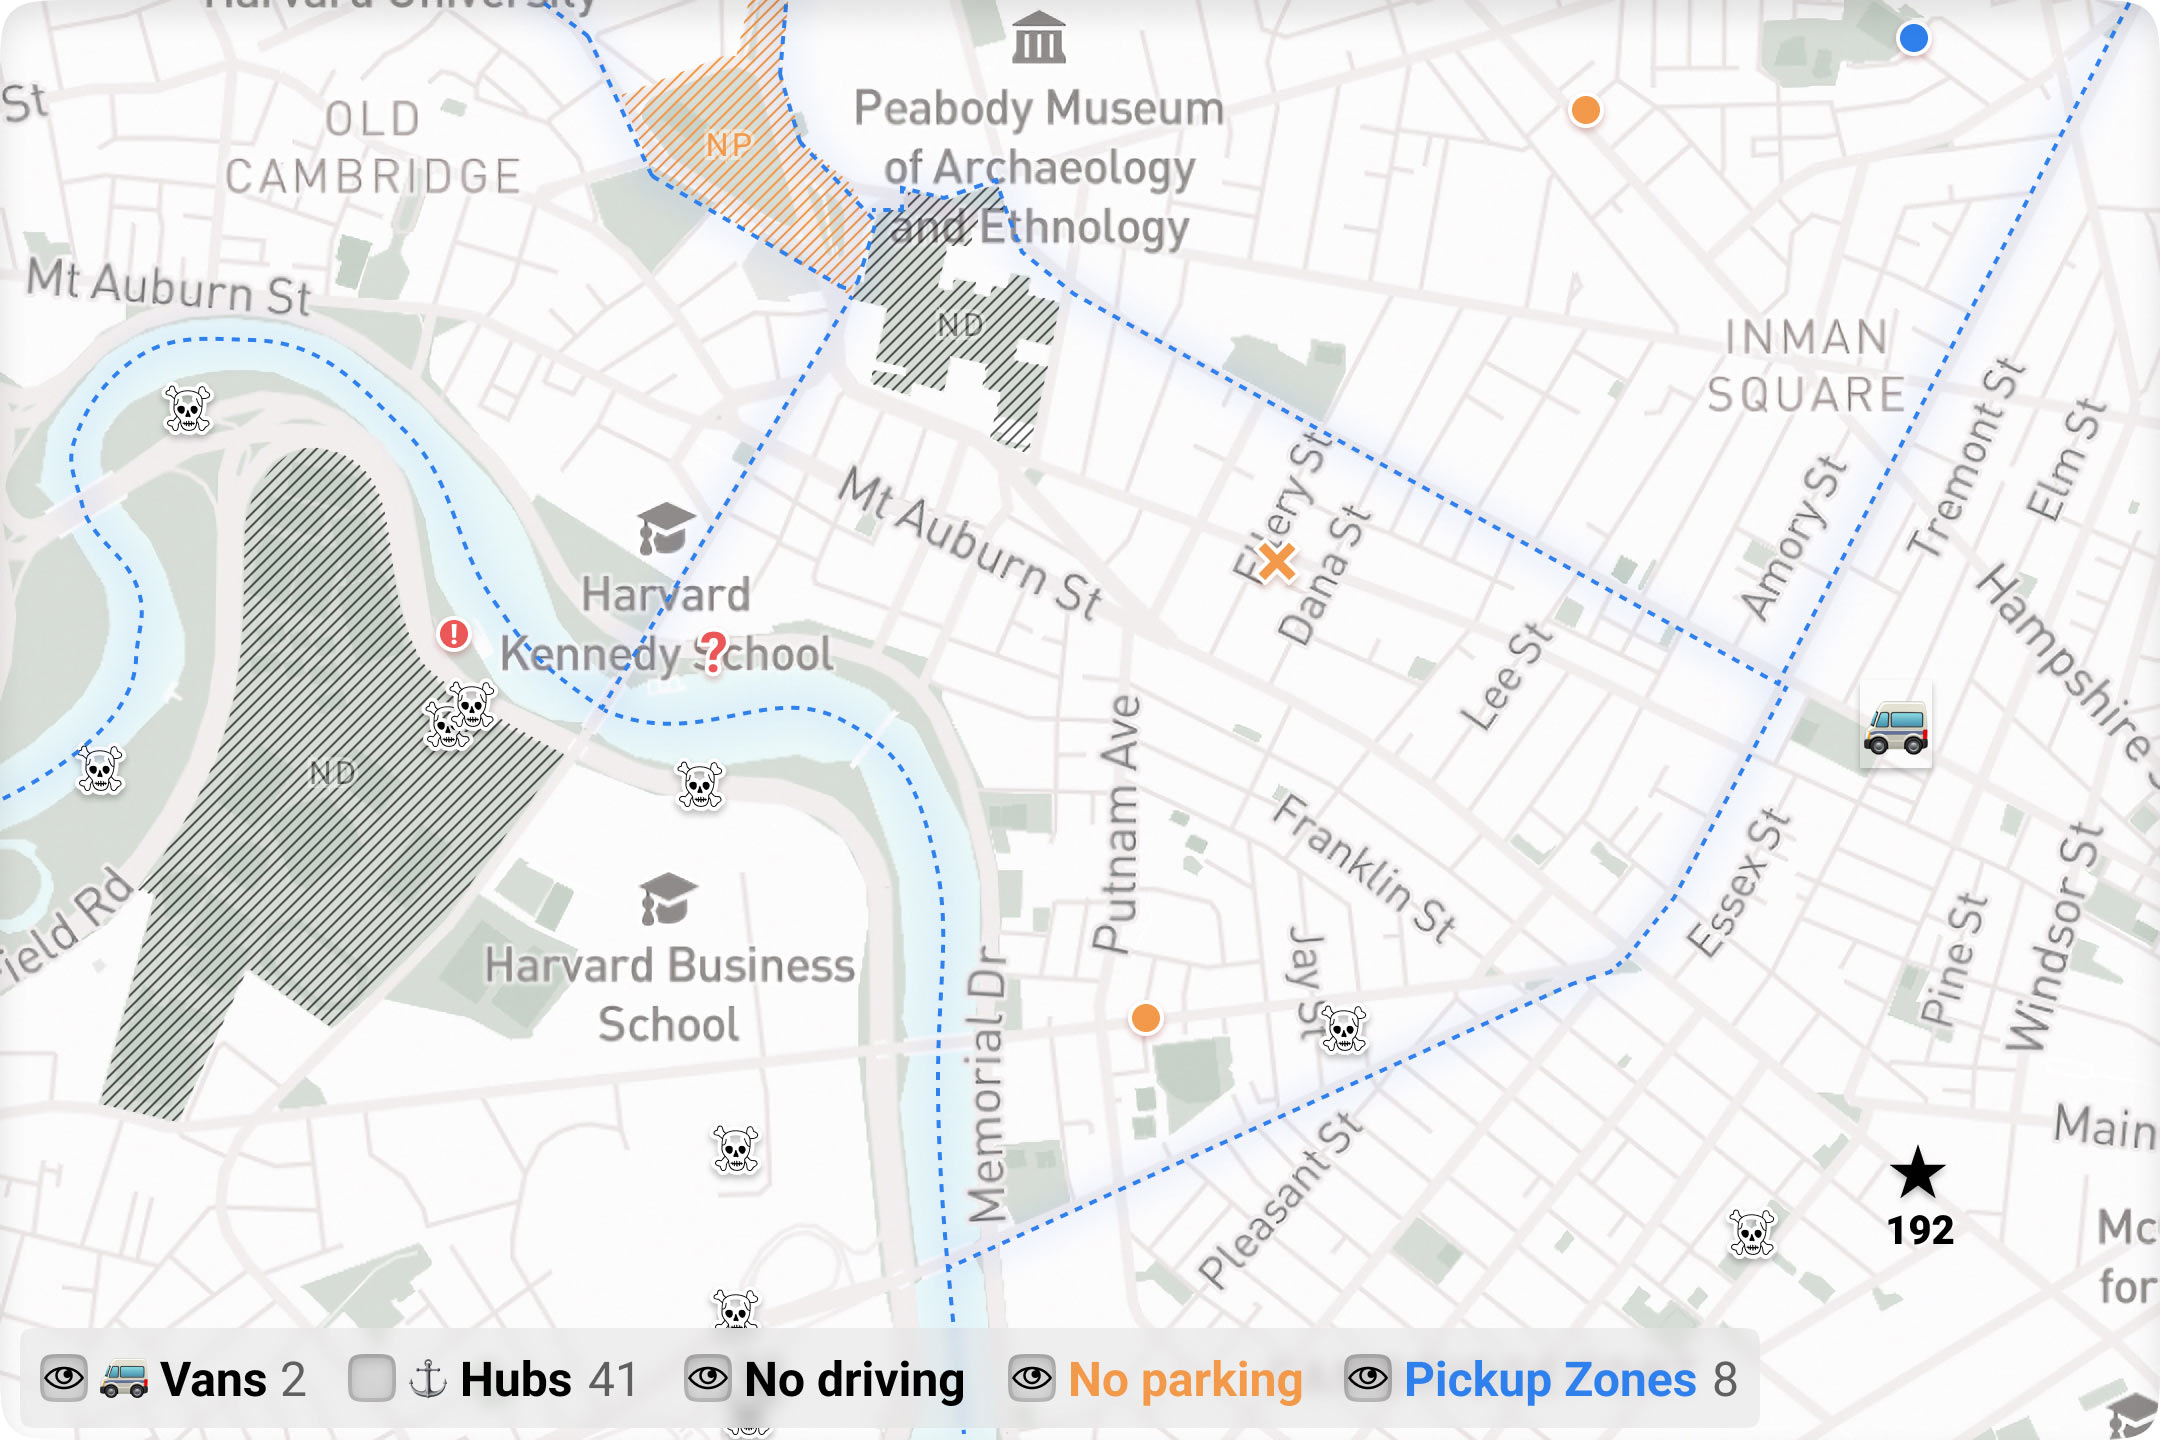
In this case, you can see that a lot of scooters have disappeared in the river area — they may have been drowned. Here you can also customize which other layers are visible on the map.
This project was done in 2022 as part of a design exploration for Superpedestrian. It is shared here to demostrate the process and illustrate how design can be used as a driver of business efficiency. Designing interfaces for business is a lot of fun.
Ilya Birman
Designer