For many people, a map of a transport network is a given, an expected part of a system, something that just is — like a fire escape plan in a building. So when I say that I design transport maps, they don’t understand. What is there to design, even?
The London underground map by Harry Beck was the world’s first transport map to use the principles of electrical circuit drawings:
All line segments were put to the angles of 45° and 90°. The distances between stations were equalised. I wrote about it in part three of my “Maps and reality” series, Diagrams.
This schematic approach was later adopted by many transport maps of the world. But not every time was this a good idea. This is one useless map (Samara, Russia):
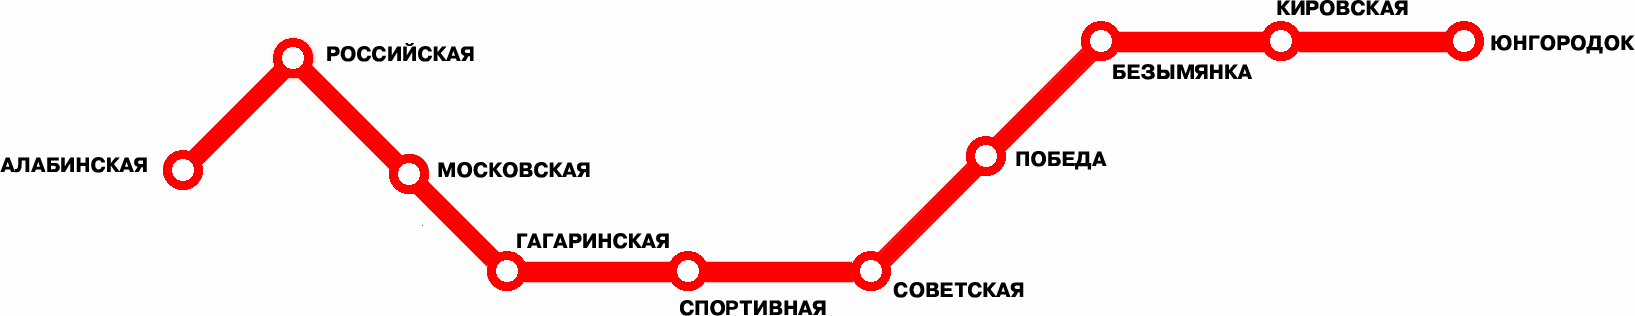
It adds almost nothing to just listing the stations:
Алабинская · Российская · Московская · Гагаринская · Спортивная · Советская…
Beck’s design dealt with growing complexity and spread of London underground rail network. When there is just one line, it’s better to put this line in context. See our Ekaterinburg metro map, for example:
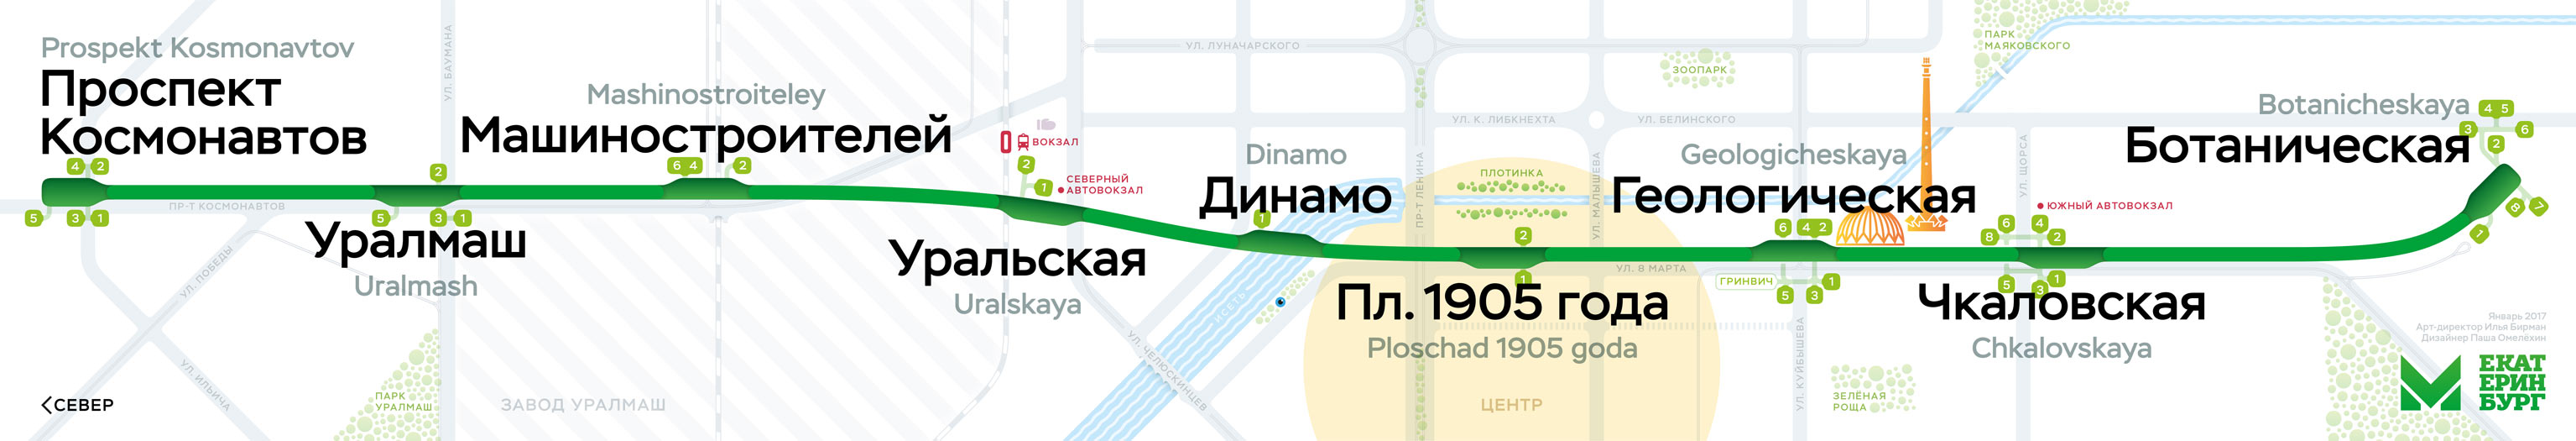
Every transport network requires a specialised solution.
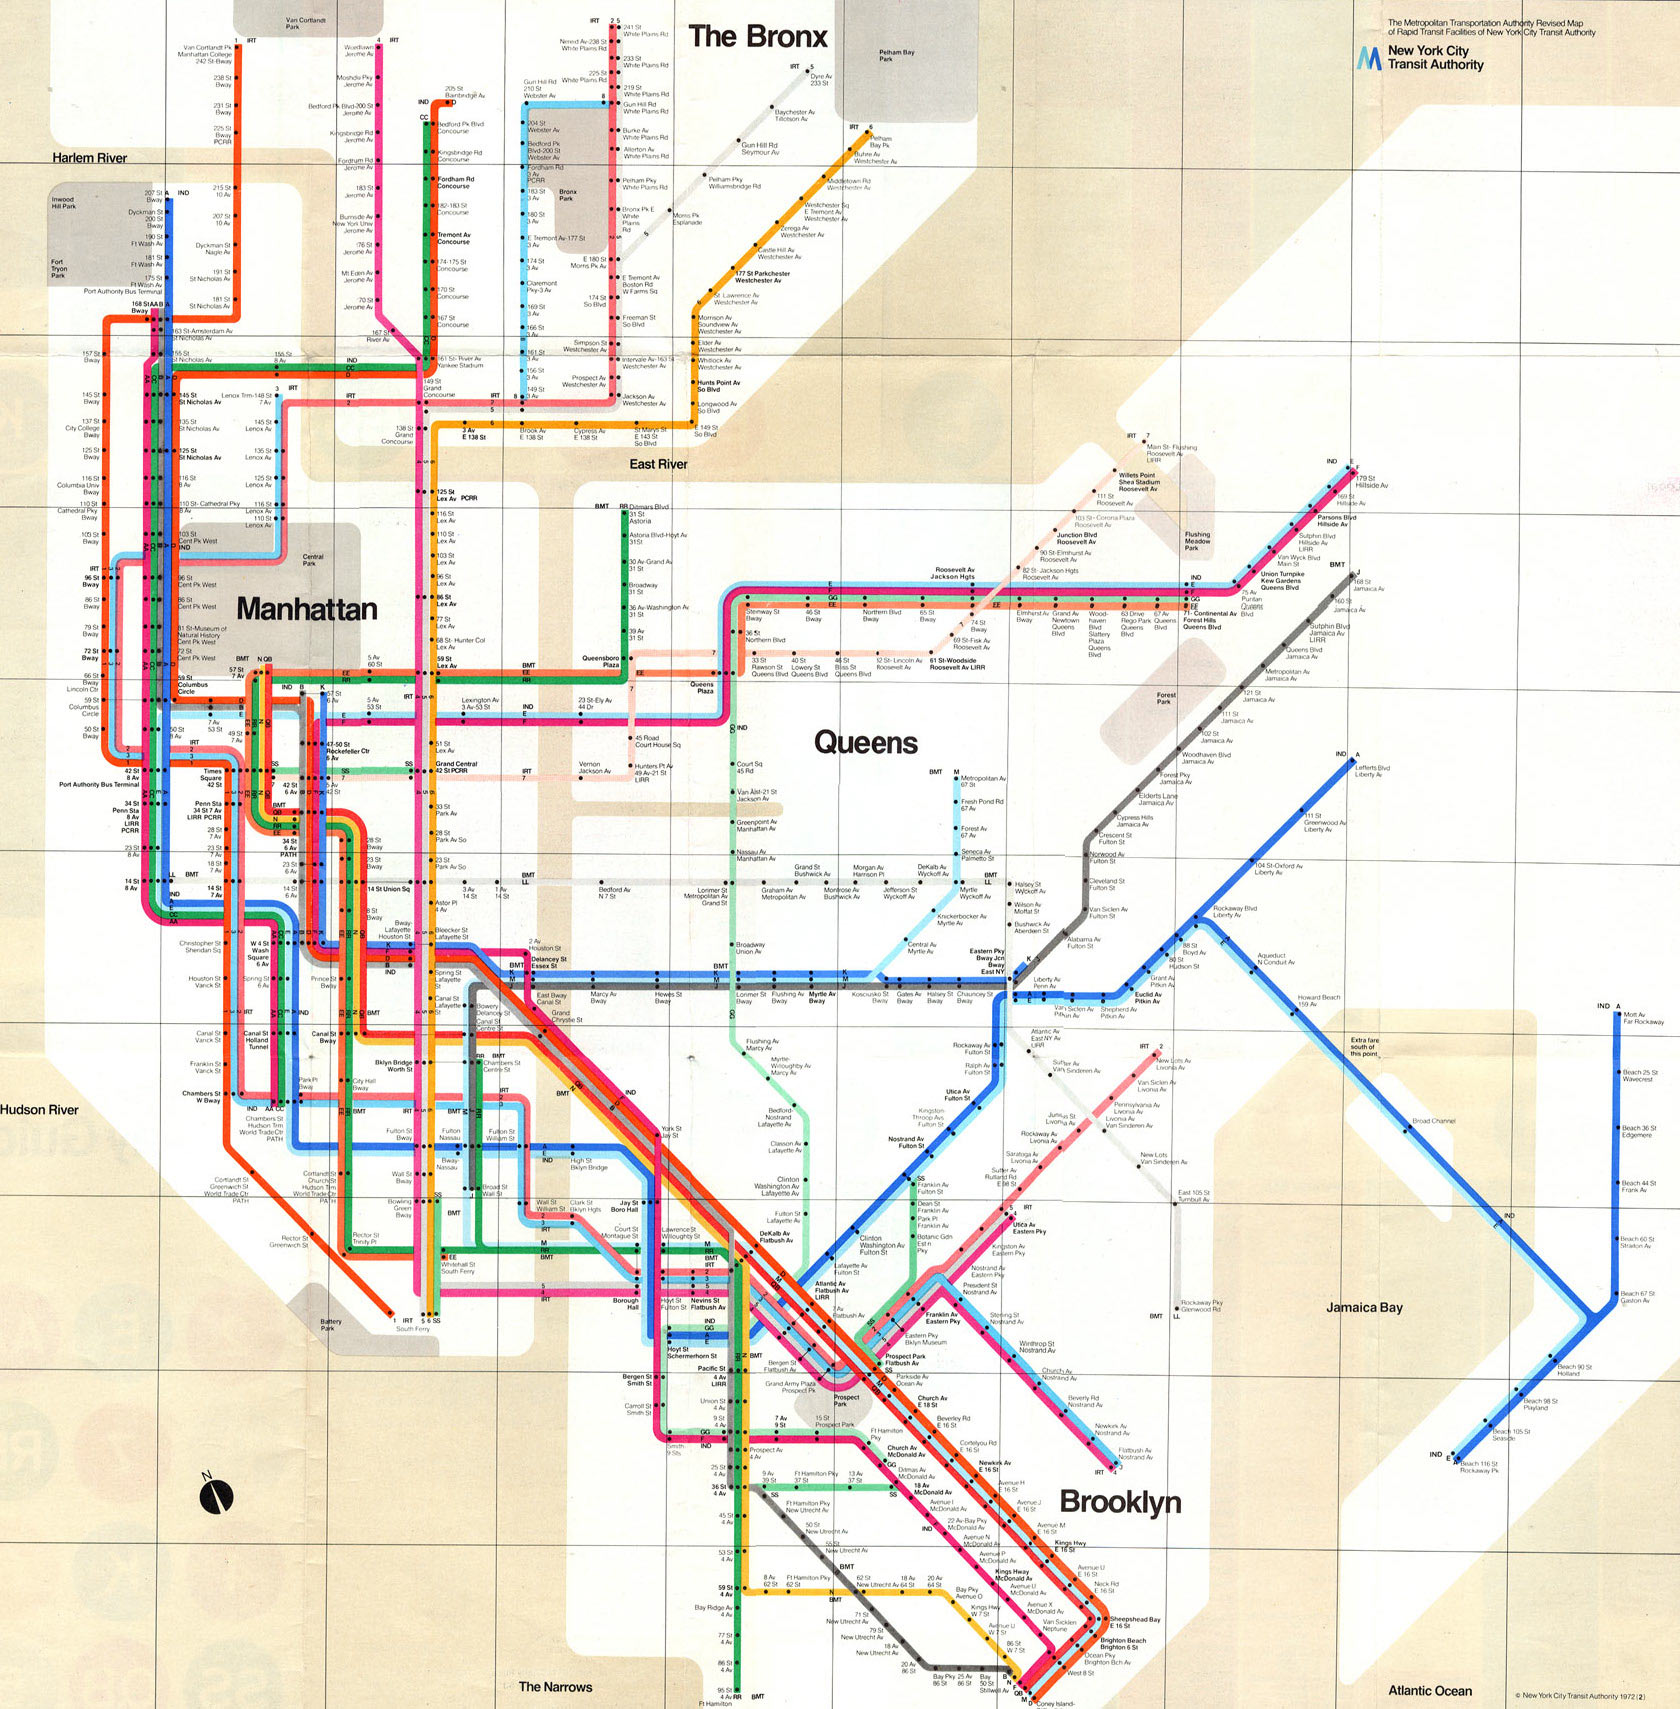
Let’s look at New York. The subway is large and complicated, but quite different from London: trains can have different routes, which are denoted by both numbers and letters. In 1972, Massimo Vignelli designed this map:
In London, ticks are used to depict stations:
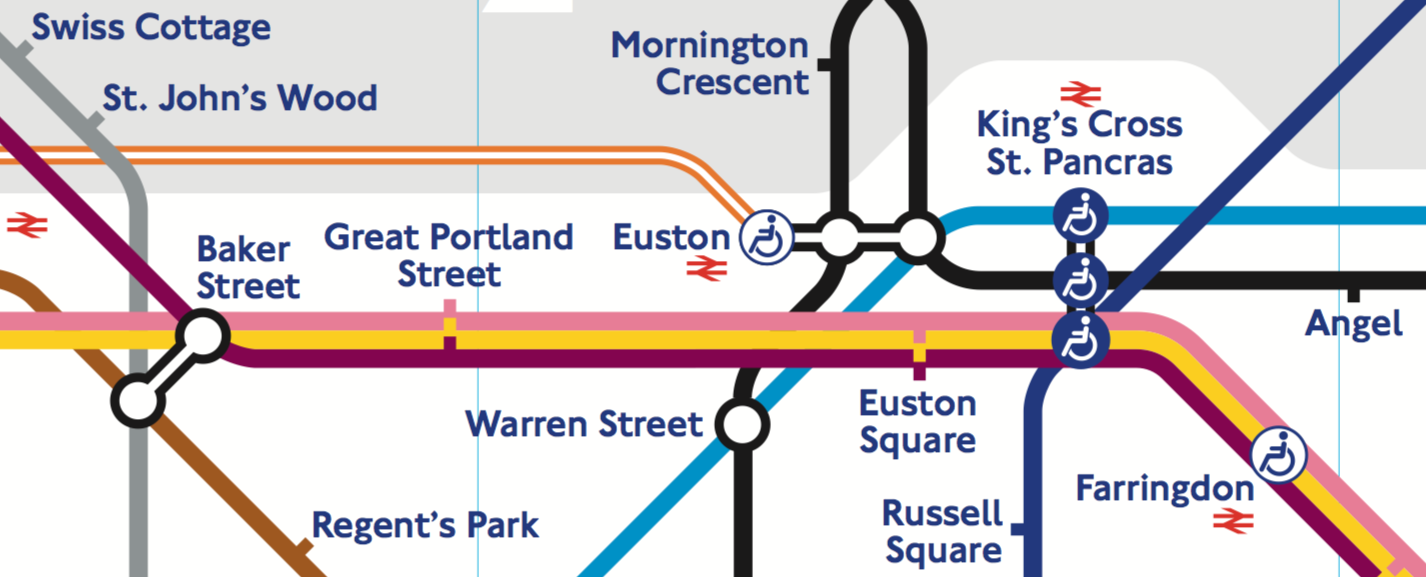
Vignelli couldn’t have used them in New York. In London, lines rarely run together through the same stations. And when they do, all trains in a “wisp” stop at all of them — see Great Portland Street and Euston Square above.
In New York, such wisps are everywhere, and some trains don’t stop at some stations. So when there is a stop on a particular route, Vignelli puts a black bullet in the route’s line:
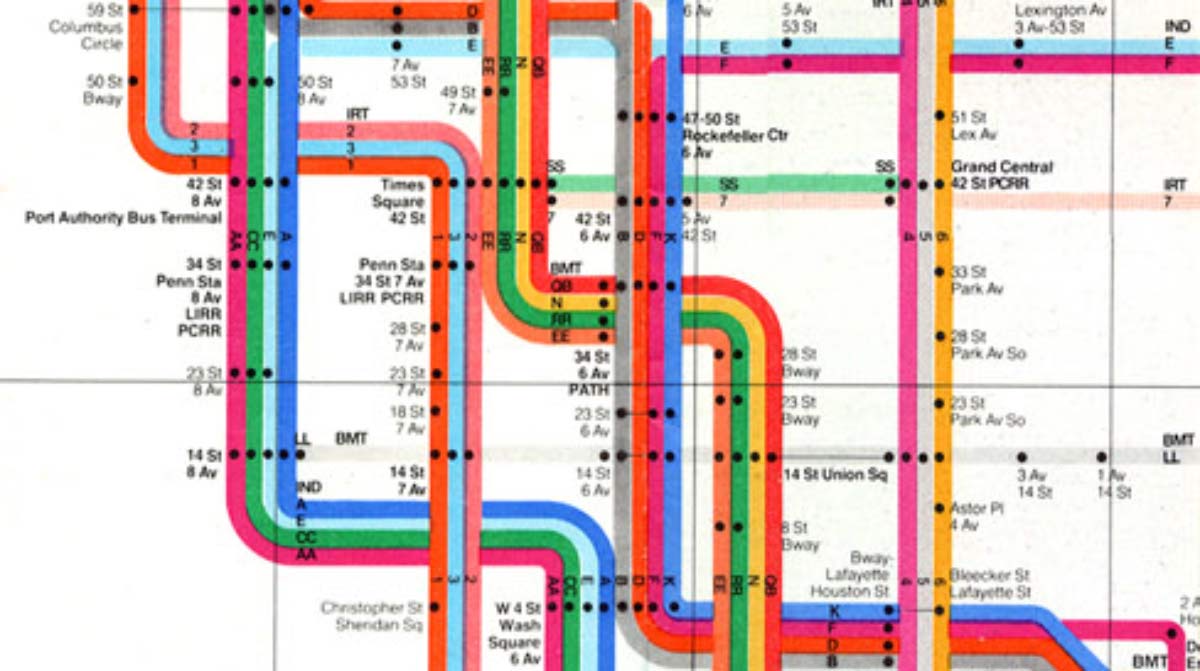
You can see that at some stations, not every line has a bullet.
Vignelli’s map was beautiful, but, unfortunately, unsuccessful. People considered it too abstract. Having no geographical reference, the eye had nothing to catch on. Also, the stations named with street numbers looked identical — the font was just too small for that.
This design was the closest to London’s that New York has ever seen.
The successful design was the one by Michel Hertz (1979) — still in use. It includes parks, ponds, main streets and areas names:
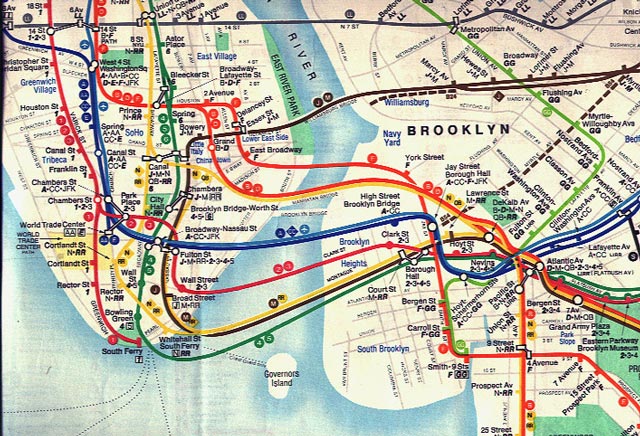
The related routes are denoted with just one line, not a wisp:
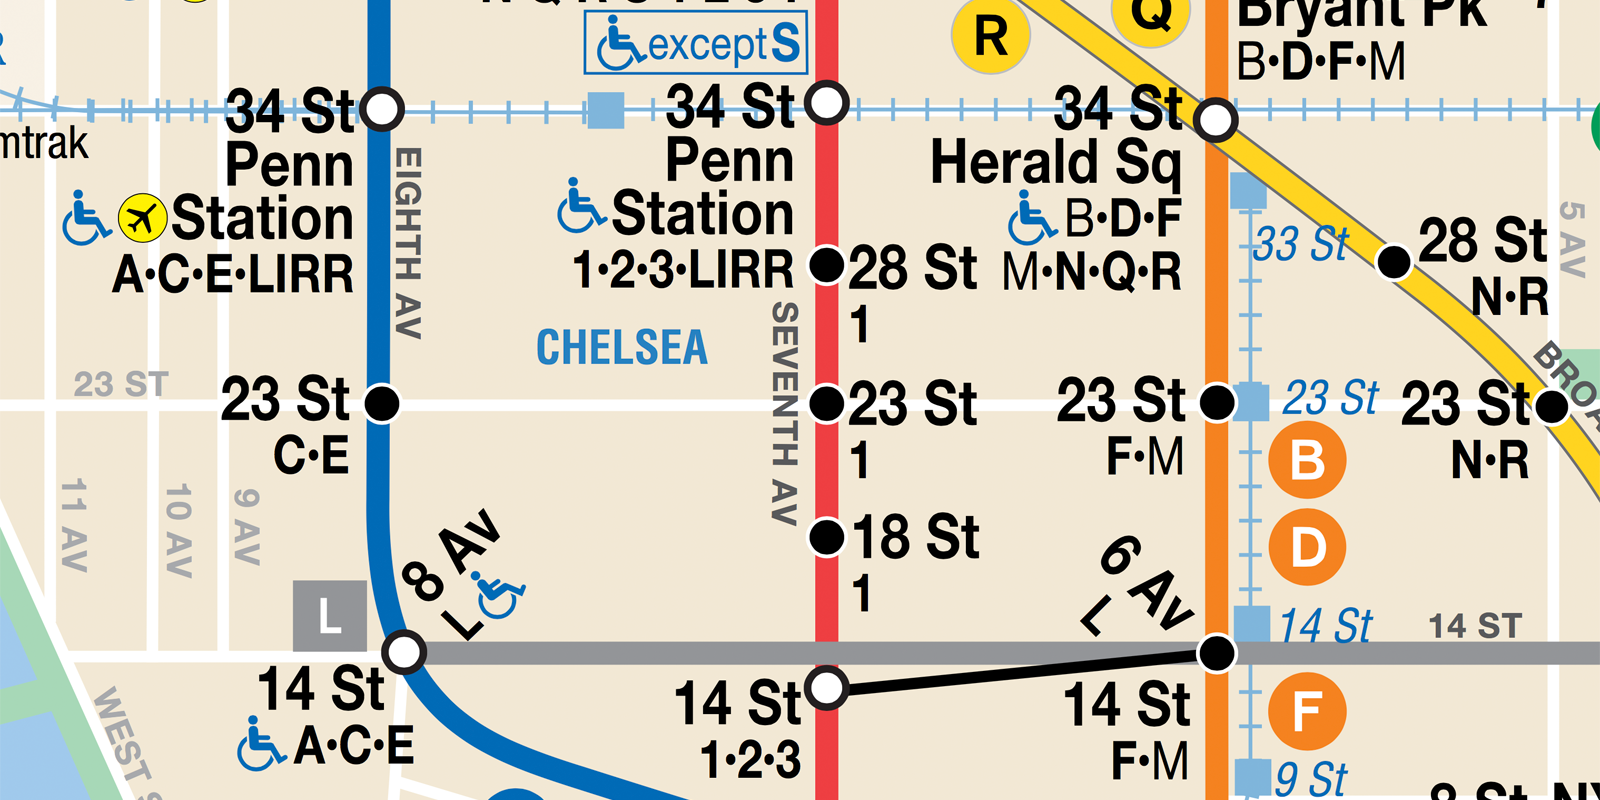
But there’s a list of stopping routes at each station. Look at the red line, for example. Only route 1 stops at 18, 23 and 28 st., but all routes stop at 14 and 34 st.
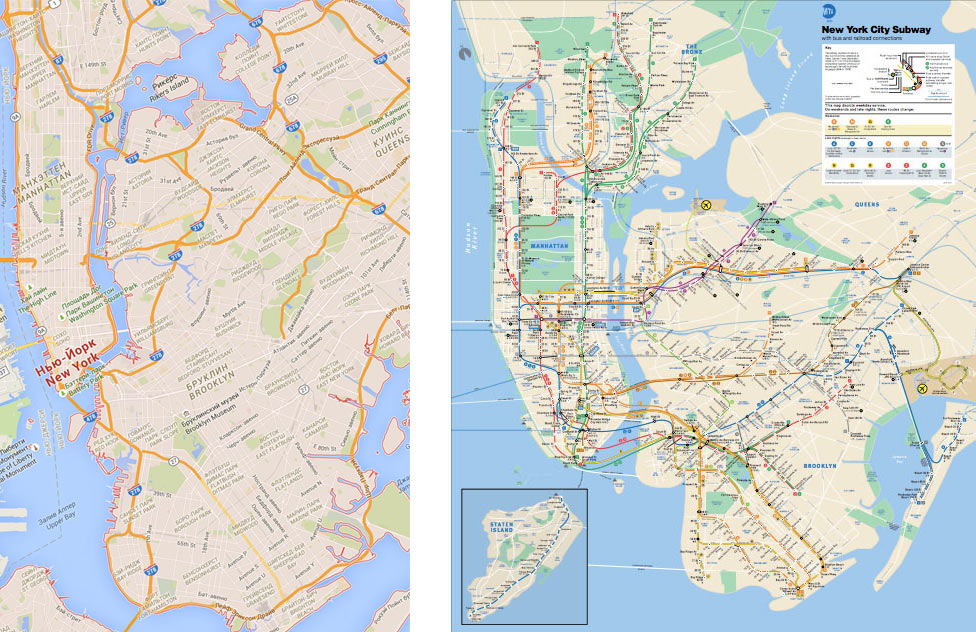
Hertz wanted his map to look geographical. But he knew that a “true” map would use the format very inefficiently. So his map is actually distorted significantly for everything to fit. Google Maps on the left, Hertz’s map on the right:
Hertz’s map doesn’t look stylish. But it has proven to work well. This is a very specific, bulletproof design tailored to New York.