Before installing Aegea on a server, you may want to try it out locally. This is a manual on how to install it locally on a Mac in a way that I find the best.
Mac comes with a pre-installed Apache. But the way it is configured is rather strange and very hard to use in a productive way. I set up separate host names for all my local projects, such that I can point the browser to the address “aegea” to open Aegea or “ib” to open my website.
Here’s how to do this.
Get Aegea package
This part is the same as in How to install Aegea.
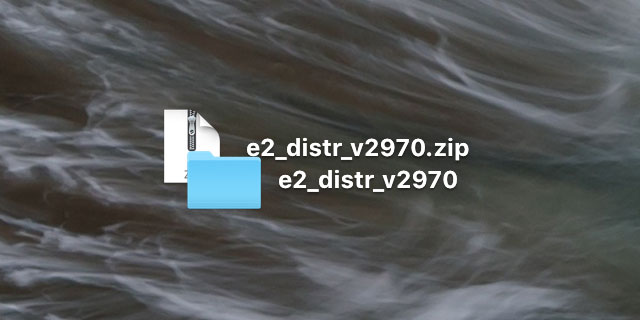
Download the Aegea zip archive from the website and unzip it:
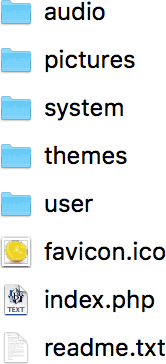
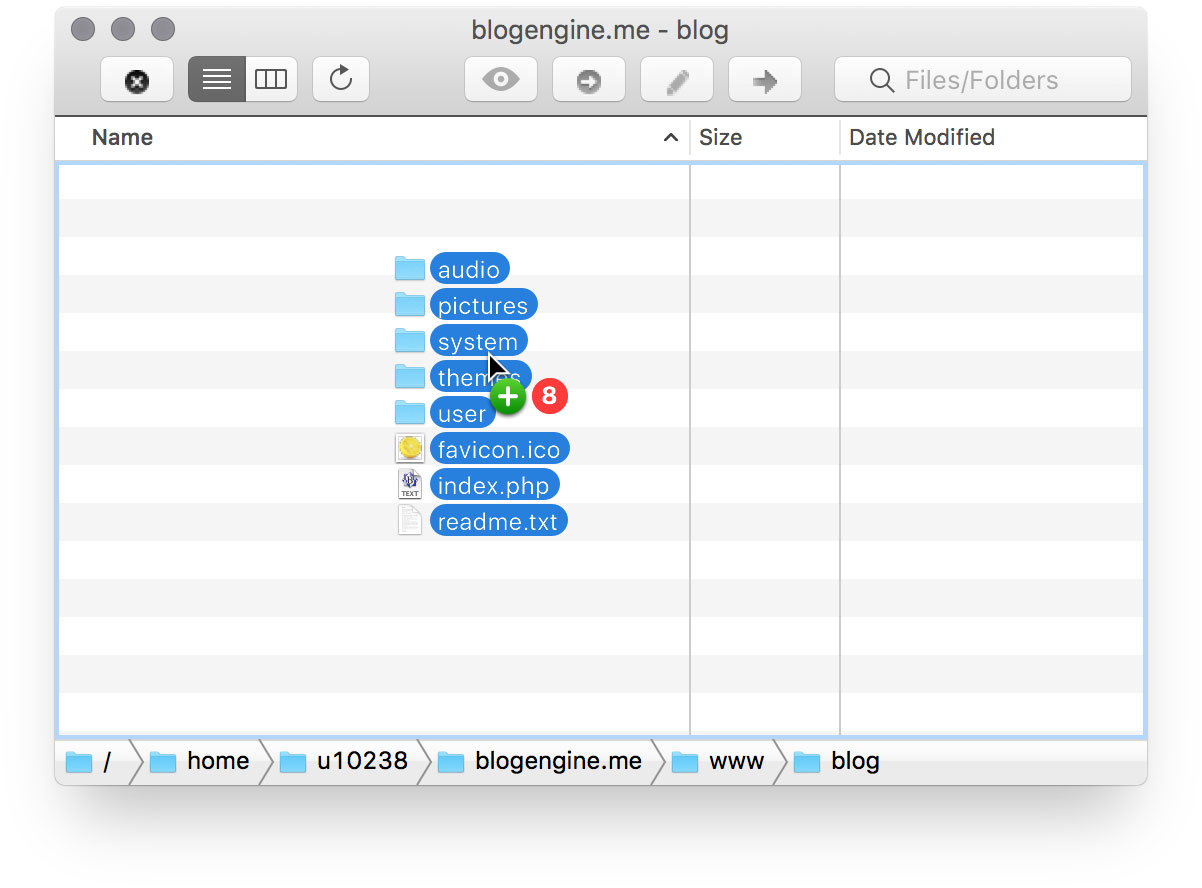
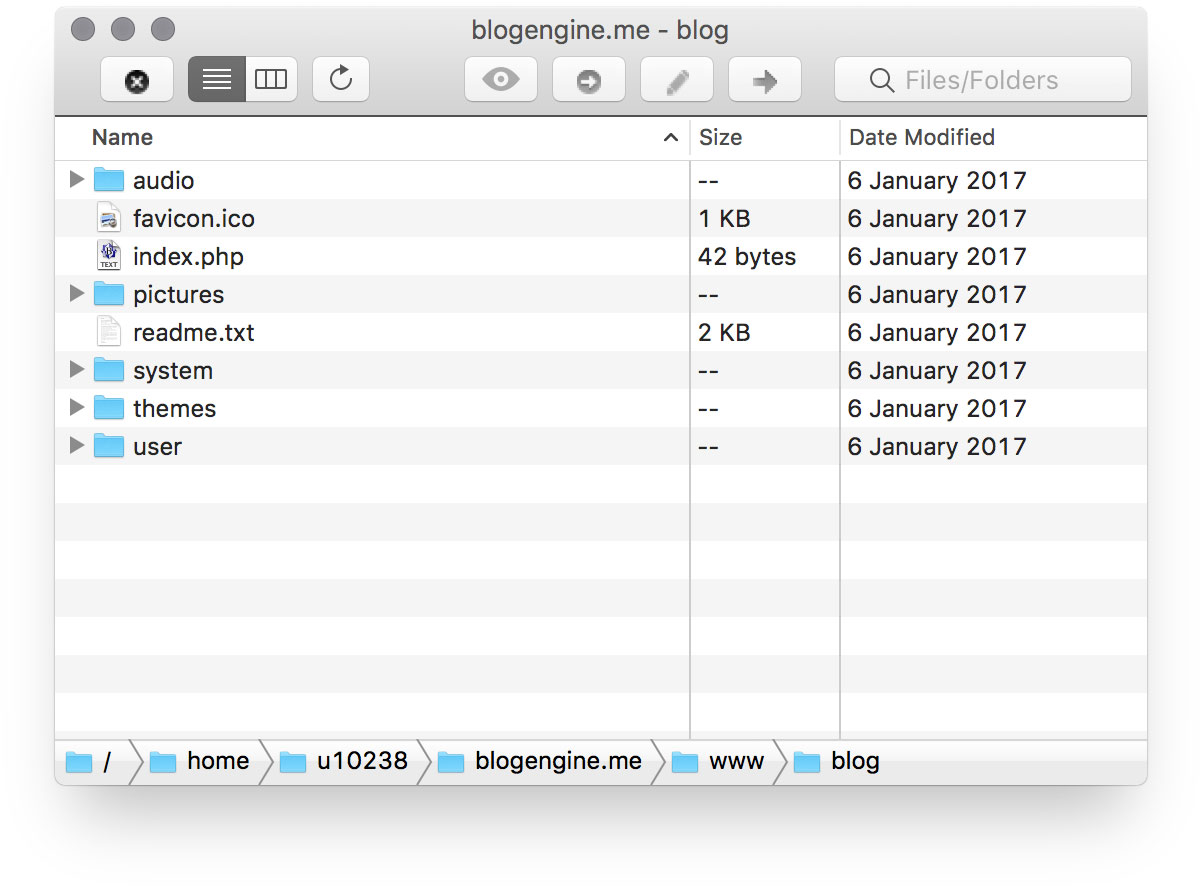
Inside, you will see files like these (the list may differ depending on the version):
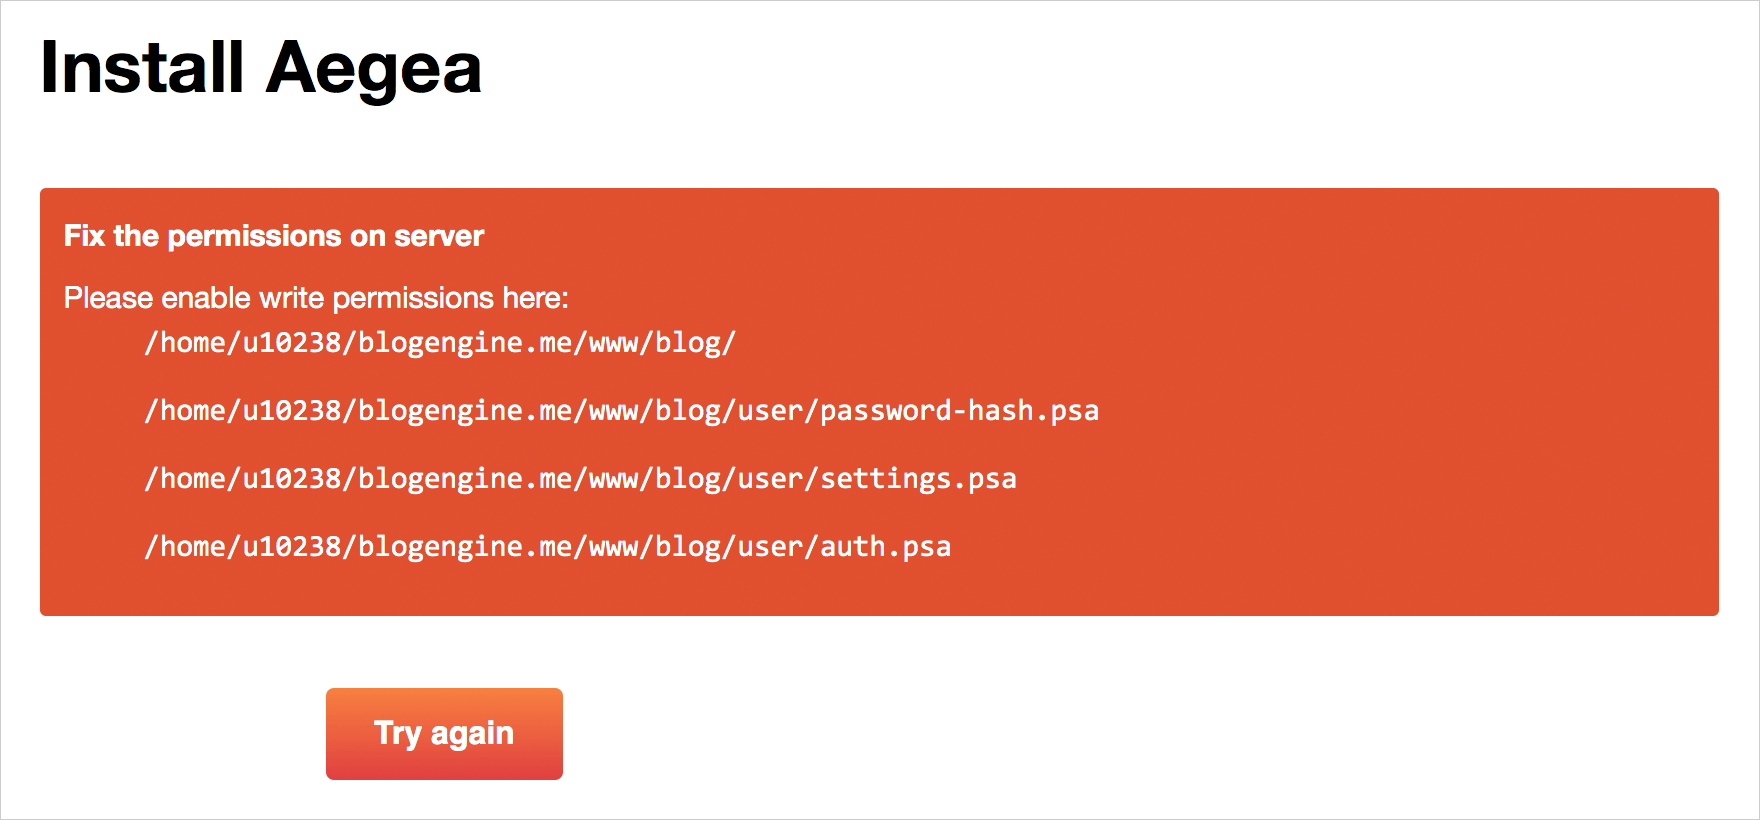
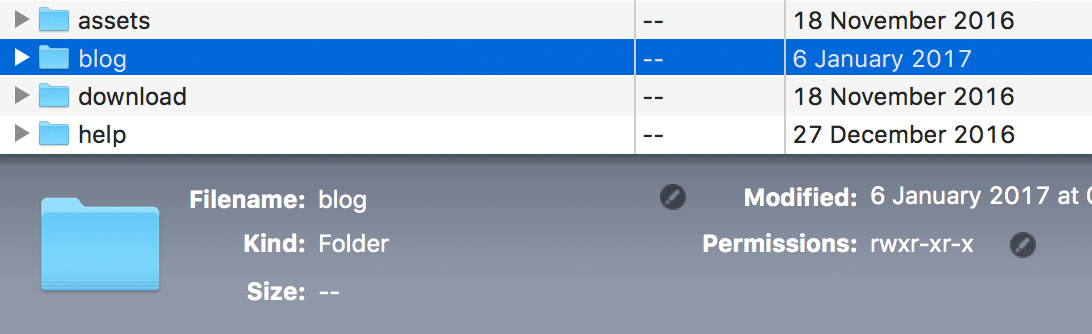
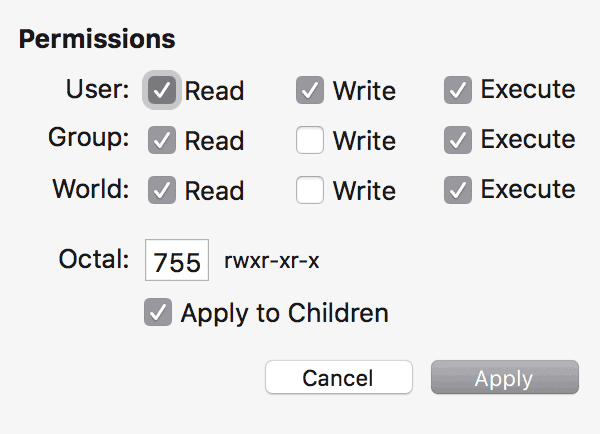
Put these files in ~/Sites/aegea/ folder. Select this folder in Finder, press ⌘I, go to the end of the panel, open the lock and change all permissions to “Read & Write”. Then click the gear and select “Apply to enclosed items”.
Configure Apache
Open /etc/apache2/httpd.conf. Uncomment this line:
LoadModule rewrite_module libexec/apache2/mod_rewrite.so
Do not uncomment the PHP line.
Add the following after other Directory sections:
<Directory "/Users/ilyabirman/Sites">
    Options Indexes FollowSymLinks Multiviews
    MultiviewsMatch Any
    AllowOverride All
    Require all granted
</Directory>
Replace ilyabirman with your username.
Now find and uncomment this line:
Include /private/etc/apache2/extra/httpd-vhosts.conf
Now open the very file /etc/apache2/extra/httpd-vhosts.conf and add this:
<VirtualHost *:80>
    DocumentRoot "/Users/ilyabirman/Sites/aegea"
    ServerName aegea
    ErrorLog "/private/var/log/apache2/aegea.l-error_log"
</VirtualHost>
Again, replace ilyabirman with your username.
Finally, open the /etc/hosts file and add the hostname you want to use for local projects:
127.0.0.1 aegea
Now if you point the browser to the address “aegea”, it will request it from the local machine. If Apache is running locally, it will capture the request and look at ~/Sites/aegea/ folder for the content to serve. This will not work just yet because we haven’t installed PHP.
Install PHP and MySQL
Mac comes with a pre-installed PHP, but it’s rather old and doesn’t include GD (a library that Aegea uses to work with images). Install good PHP. I use the installers from the page PHP for macOS as binary package and like them very much. They have never failed me.
Install PHP 5.6 (better for now) or PHP 7.1 by following the instructions on the page.
This will make Apache work with PHP without any changes to the httpd.conf file.
With MySQL it’s even easier: there’s an official native Mac installer available. Download the DMG file and follow the installer’s instructions. Don’t forget to Install the System Preferences pane to be able to start and stop the MySQL server from System Preferences.
Start MySQL and Apache
Open System Preferences, go to MySQL and press “Start MySQL Server”.
Open Terminal and type:
sudo apachectl start
It will ask for your password.
Create a database for Aegea
In Terminal, type:
sudo /usr/local/mysql/bin/mysql
In the MySQL prompt, type:
create database aegea;
Install Aegea
Navigate to “aegea/” with your browser. Without the final “/” Safari will try to do a Google search of “aegea”.
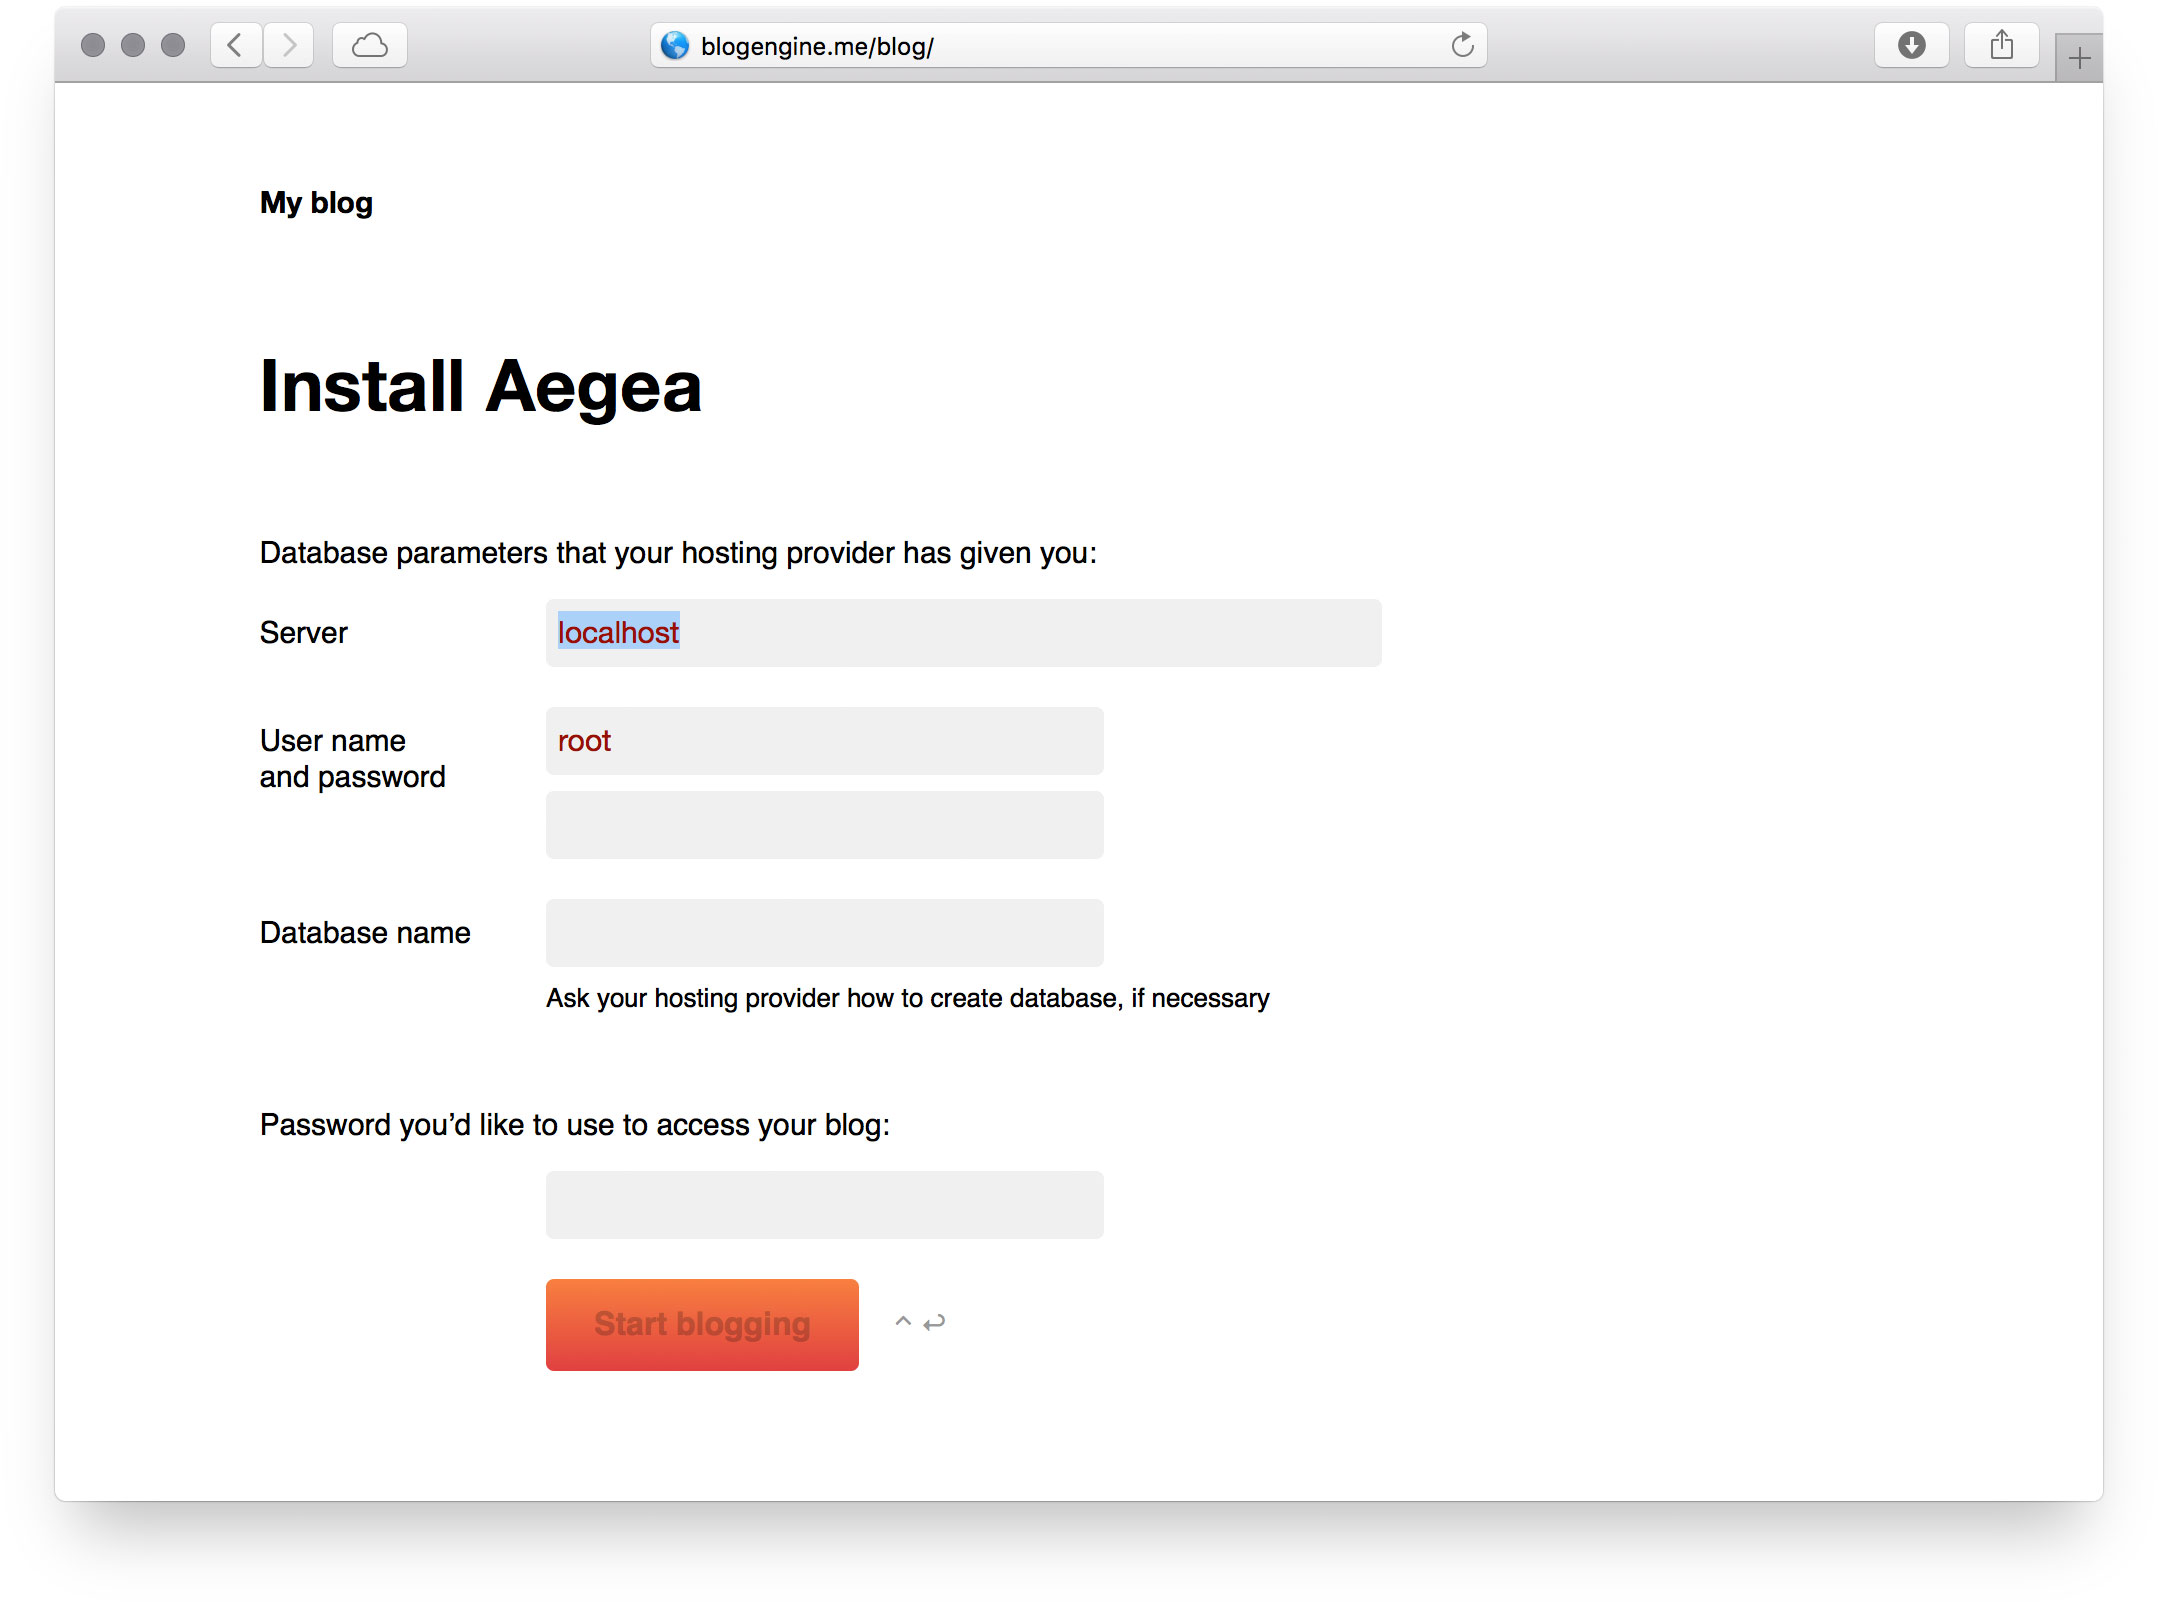
You will see Aegea installer. Enter the following MySQL database access parameters:
| Server |
127.0.0.1 |
| User name |
root |
| Password |
(leave empty) |
| Database name |
aegea |
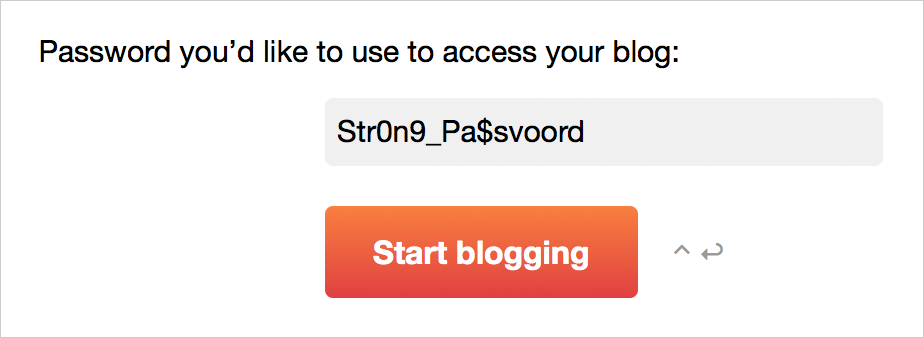
The last thing to fill in is the password that you want to use to access your blog (you can change it later):
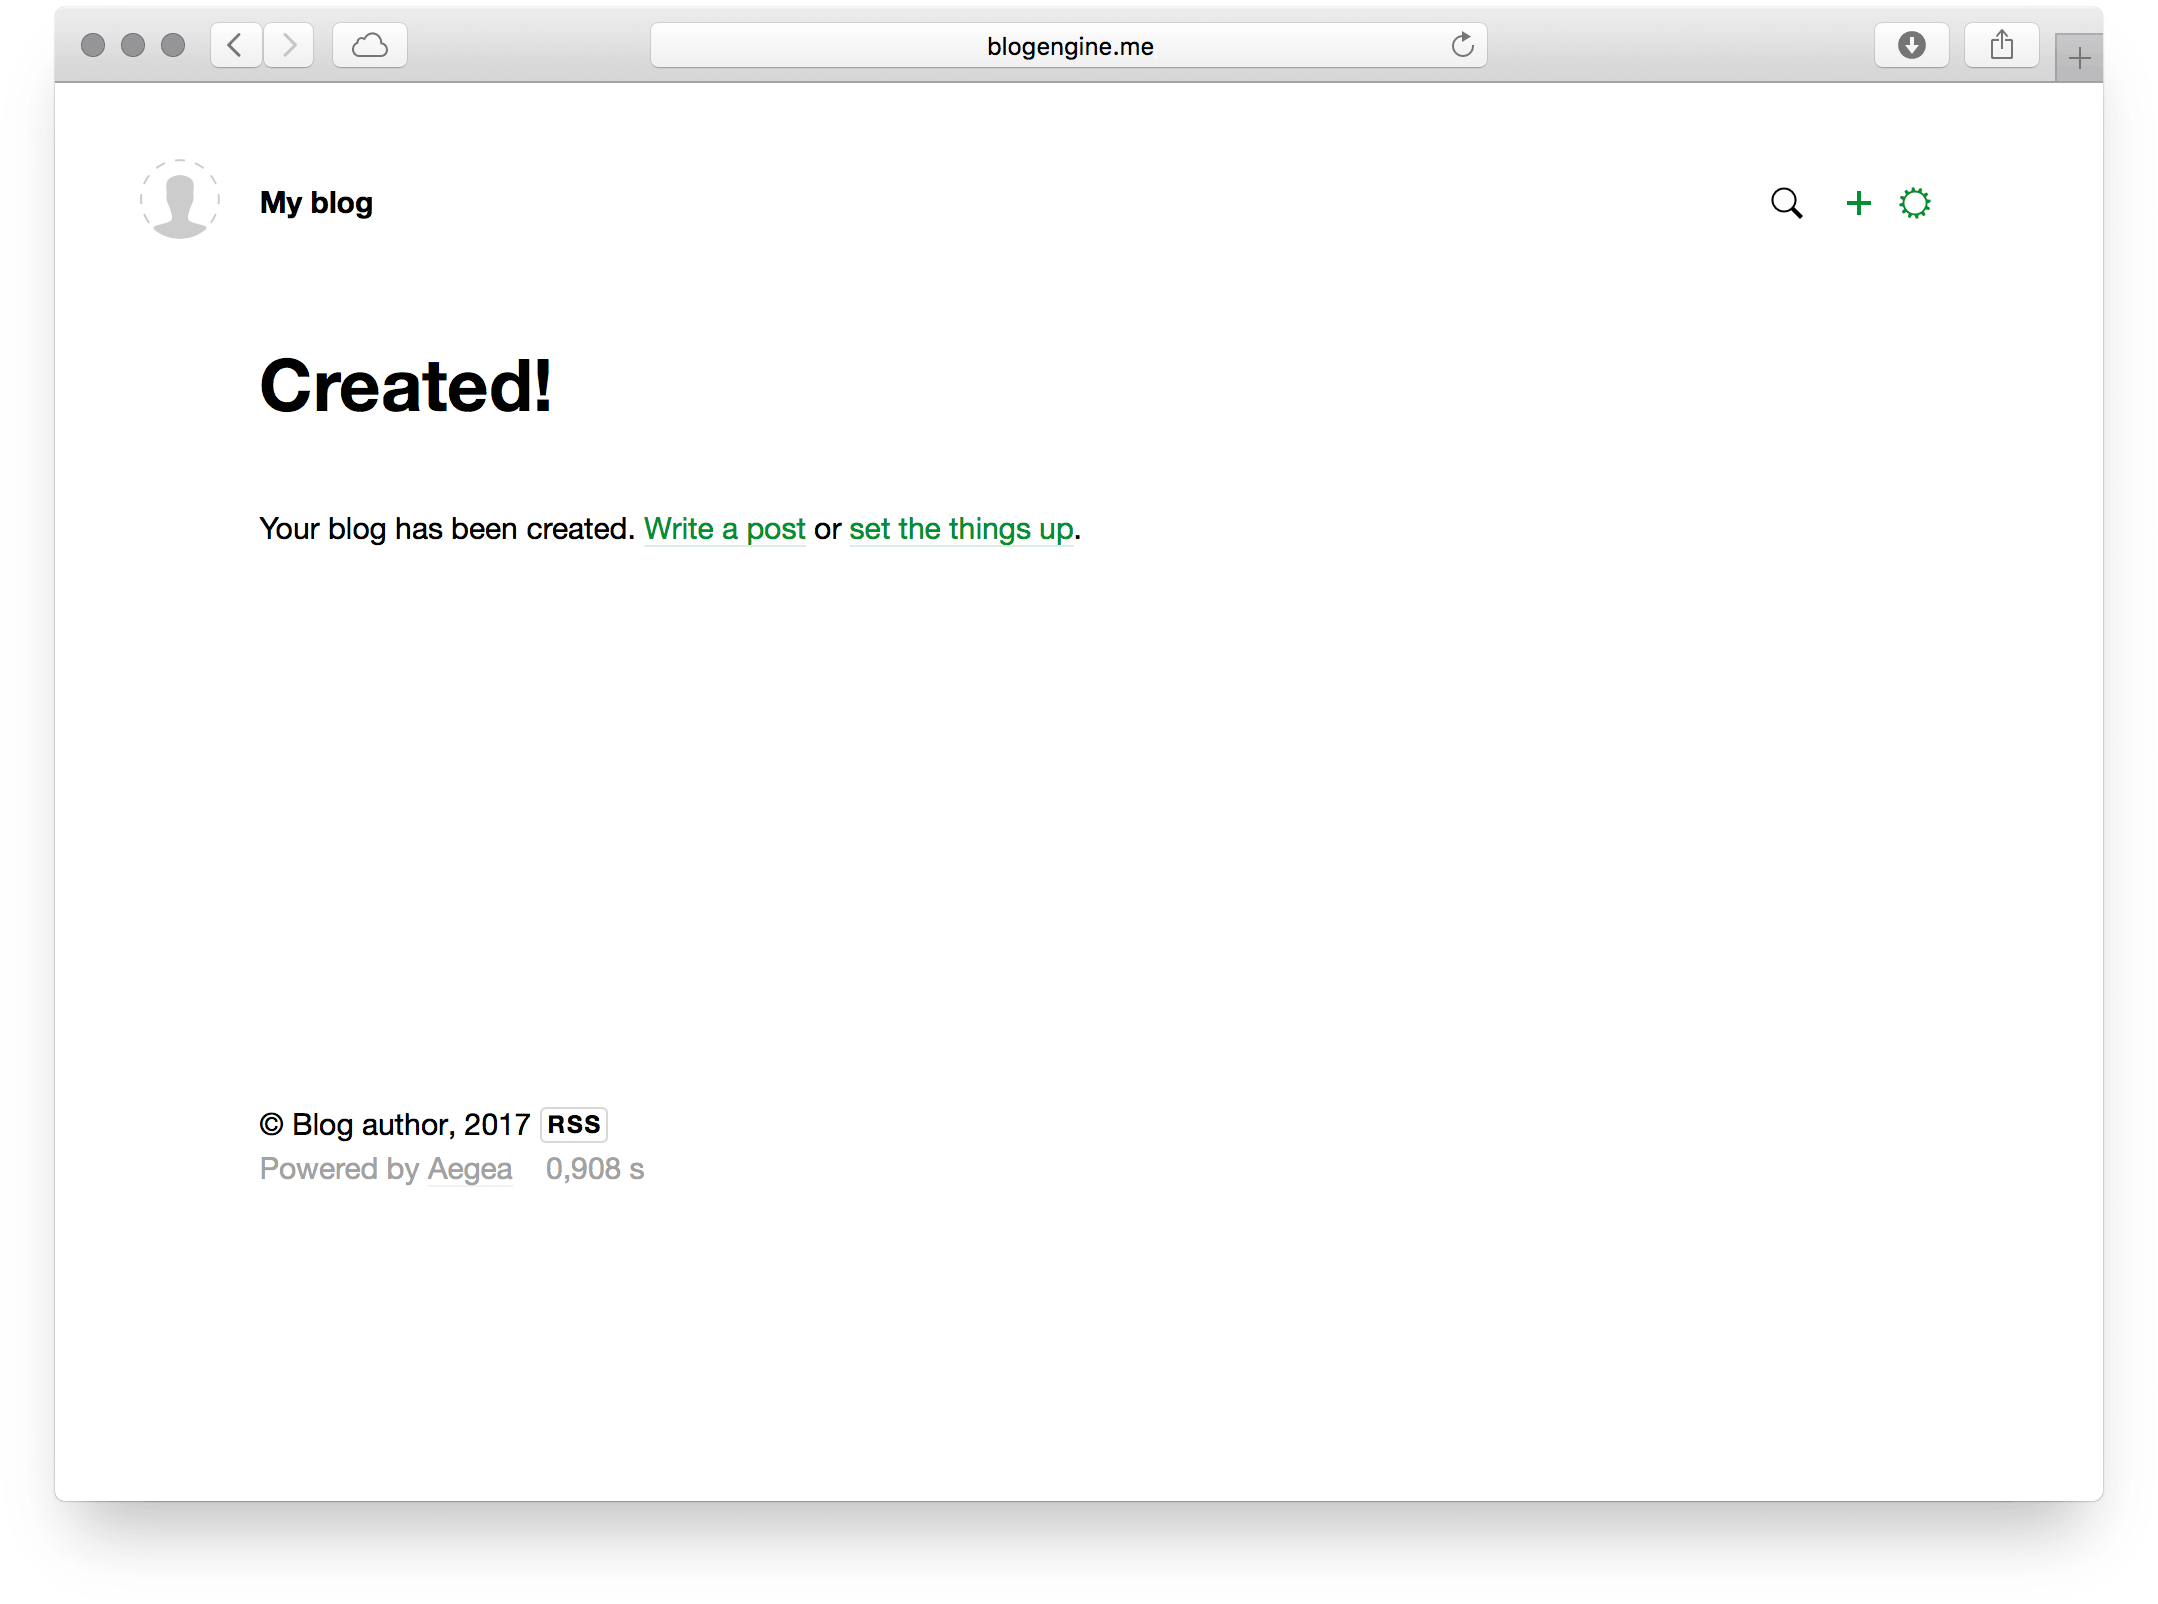
Click “Start blogging” — and that’s it.